NIfTI Group Averaging
The NIfTI Group Averaging extension provides comprehensive tools for computing group averages and statistical comparisons of NIfTI files organized by experimental groups. This extension is particularly useful for temporal interference (TI) stimulation studies where researchers need to compare field distributions across multiple subjects and experimental conditions.
Import and export participant rows
Use Import CSV/TSV, Export CSV, or Export TSV below the Subjects header. Export the current table for an editable template. The required header and an example CSV row are:
subject_id,simulation_name,group
101,L_Insula,Group1
For TSV, use tabs instead of commas. Columns may be reordered, but all headers must be present
with exactly these names. Subject IDs omit sub-; simulation names match the project catalog.
group is a required group name. Quoted fields, embedded separators, UTF-8 BOM and Windows line endings are supported.
An import replaces the table only after every row validates. A malformed file leaves existing
rows unchanged. Import checks table structure and values; dataset files are checked by the job workflow.
Workflow Example
Basic Group Analysis
- Open tool: enable NIfTI group averaging in Settings → Extensions, then select it under Extensions in the sidebar
- Configure Subjects:
- Subject 001: Simulation “stim_A”, Group “Treatment”
- Subject 002: Simulation “stim_A”, Group “Treatment”
- Subject 003: Simulation “stim_B”, Group “Control”
- Subject 004: Simulation “stim_B”, Group “Control”
- Set Parameters:
- Analysis name:
treatment_vs_control - NIfTI pattern: default
- Difference pairs: automatic (all pairs)
- Analysis name:
- Run Analysis: Generate group averages and differences
Output Structure
Results are saved to derivatives/ti-toolbox/nifti_average/{analysis_name}/:
treatment_vs_control/
├── average_Treatment.nii.gz              # Group average for Treatment
├── average_Control.nii.gz                # Group average for Control
├── difference_Treatment_minus_Control.nii.gz    # Treatment - Control
├── config.json                           # Complete analysis configuration
└── analysis_log.txt                      # Processing details
Results Visualization
The group difference analysis provides visual output showing statistical comparisons between experimental groups:
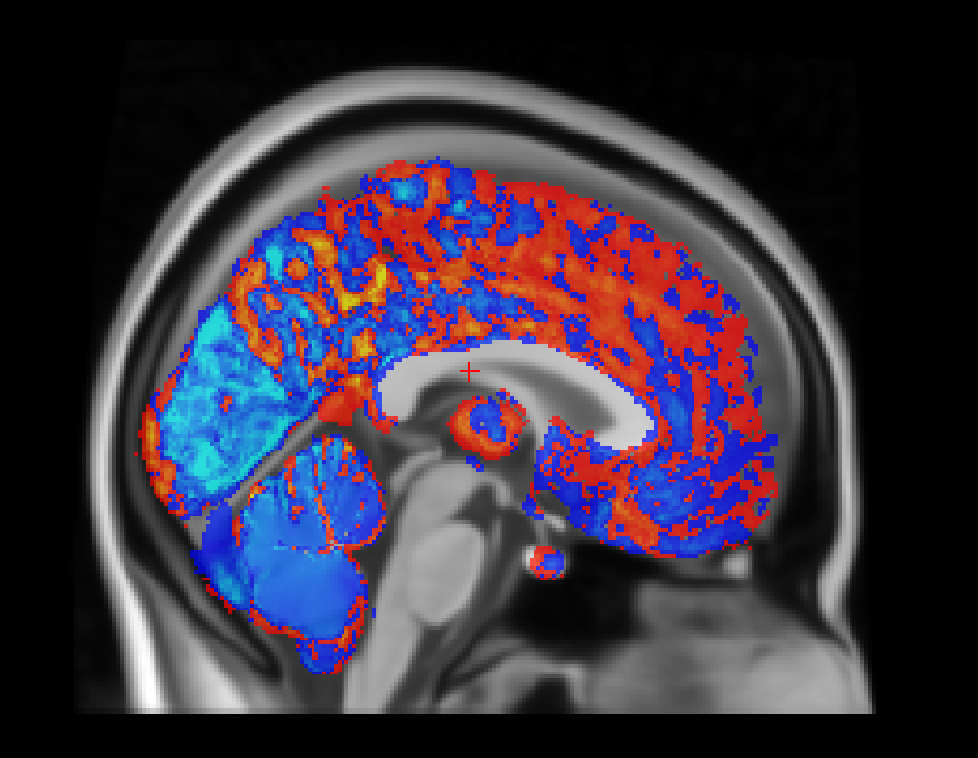
Figure: group differences in electric field distributions
CSV Configuration Management
Import Format
Required Columns:
subject_id: Subject identifier (without ‘sub-‘ prefix)simulation_name: Simulation directory namegroup: Group assignment label
Example CSV:
subject_id,simulation_name,group
001,HIPP_L_stim,Treatment
002,HIPP_L_stim,Treatment
003,HIPP_R_stim,Control
004,HIPP_R_stim,Control
005,HIPP_L_stim,Treatment
Export Functionality
- Complete Configuration: All subject-group assignments
- Analysis Ready: Formatted for re-import or sharing
- Documentation: Serves as analysis record