Reading the Results
What one Analyzer run reports and writes. The maths behind each field and ratio is on Field definitions.
Metrics
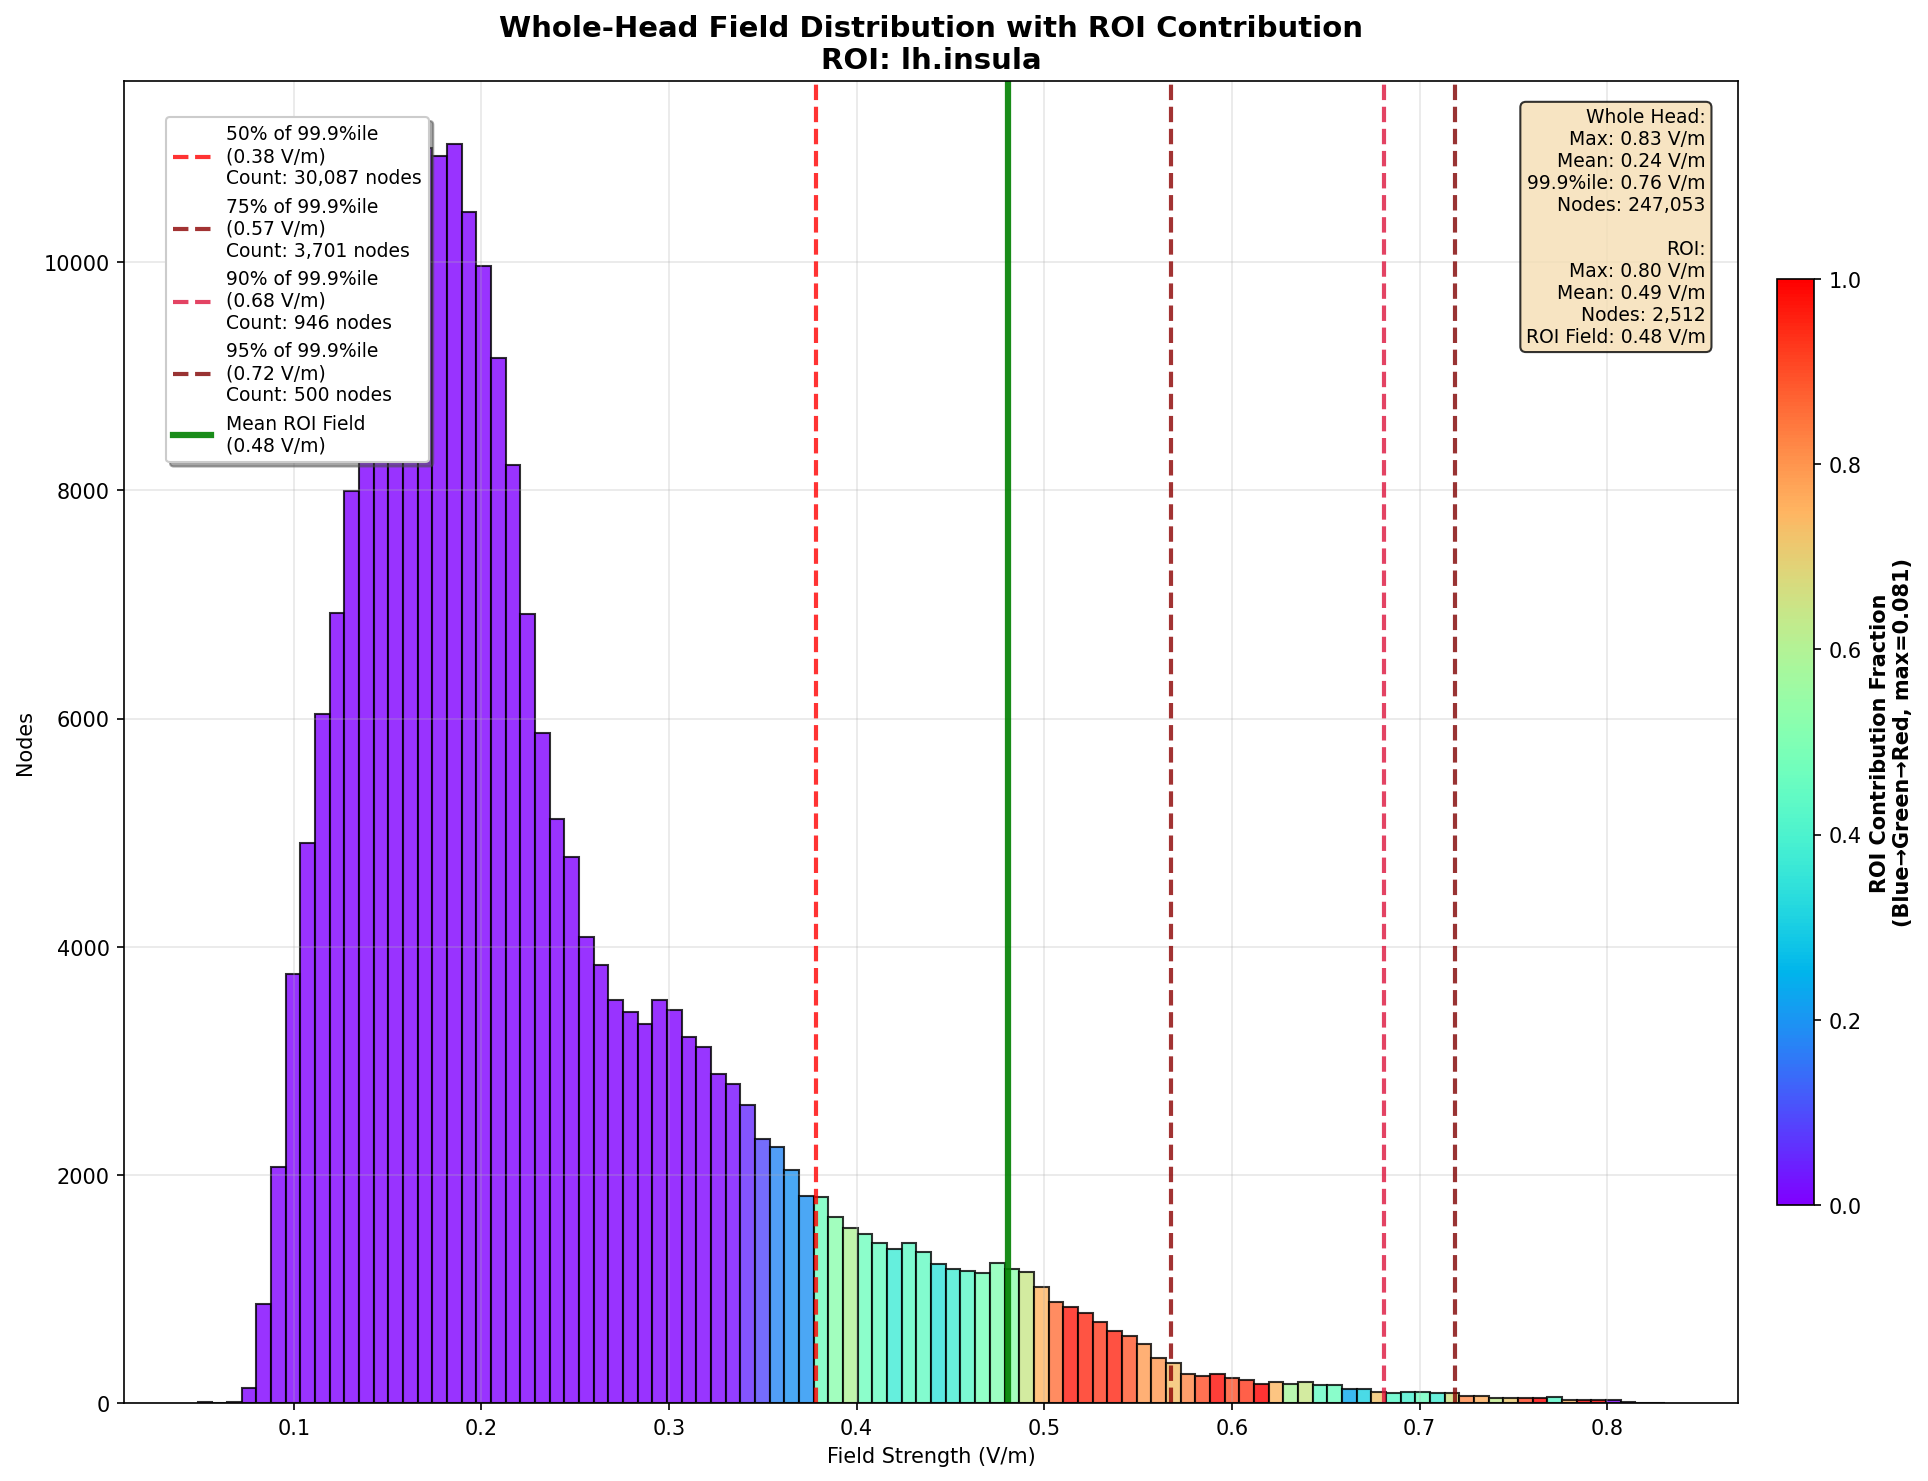 The field over the whole grey matter, each bar coloured by how much of it lies in the target, with the target mean and hot-spot cutoffs marked.
| Metric | In words | Units |
|---|---|---|
| ROI mean / max | Area- or volume-weighted mean, and maximum, of the field in the target | V/m |
| Grey-matter mean | The same mean over the whole grey matter (mesh) or selected tissue (voxel) | V/m |
| Focality | ROI mean ÷ grey-matter mean; 1 means the target is no stronger than average | ratio |
| Normal component | Mean, max and focality of TI_normal (mesh only) |
V/m |
| 95th / 99th / 99.9th percentile | Robust peaks of the field over the grey matter or tissue | V/m |
| Hot-spot area / volume | Grey matter (cm²) or tissue (cm³) at ≥ 50, 75, 90, 95 % of the 99.9th percentile | cm² / cm³ |
| Carrier focality | The same focality on hf_peak (zero-to-peak carrier) and hf_rms (RMS carrier over time) |
ratio |
| TI selectivity | Focality ÷ hf_peak focality; above 1 the modulation is more focal than its carriers (details) |
ratio |
Units follow the analysed field: hf_power_density gives W/m³.
Output files
Each analysis writes one folder, Analyses/<Mesh|Voxel>/<name>/:
| File | What it is |
|---|---|
results.csv |
every metric above, one row each |
analysis.json |
the target and settings the run used |
roi_overlay.msh (mesh) / roi_overlay.nii.gz (voxel) |
the field inside the target, zero elsewhere |
scene.tetravox.json |
a TetraVox scene of the overlay, opened by double-clicking |
Open a finished analysis from Results or the job’s Open in TetraVox.
Viewing the output
Three targets on Ernie, each simulated with its own montage (two channels, 1 mA each) and analysed, then opened in TetraVox. Each target’s images share one colour window, the grey-matter 1st–99.9th percentile of TI_max for that simulation, so compare colours within a target, not across them. The crosshair is on the target and the target is outlined in green.
Left hippocampus
Montage LH2 (F8–P8 and T7–TP7, EEG10-10_Cutini_2011). Voxel analysis, Harvard-Oxford subcortical atlas (MNI, warped to the subject).
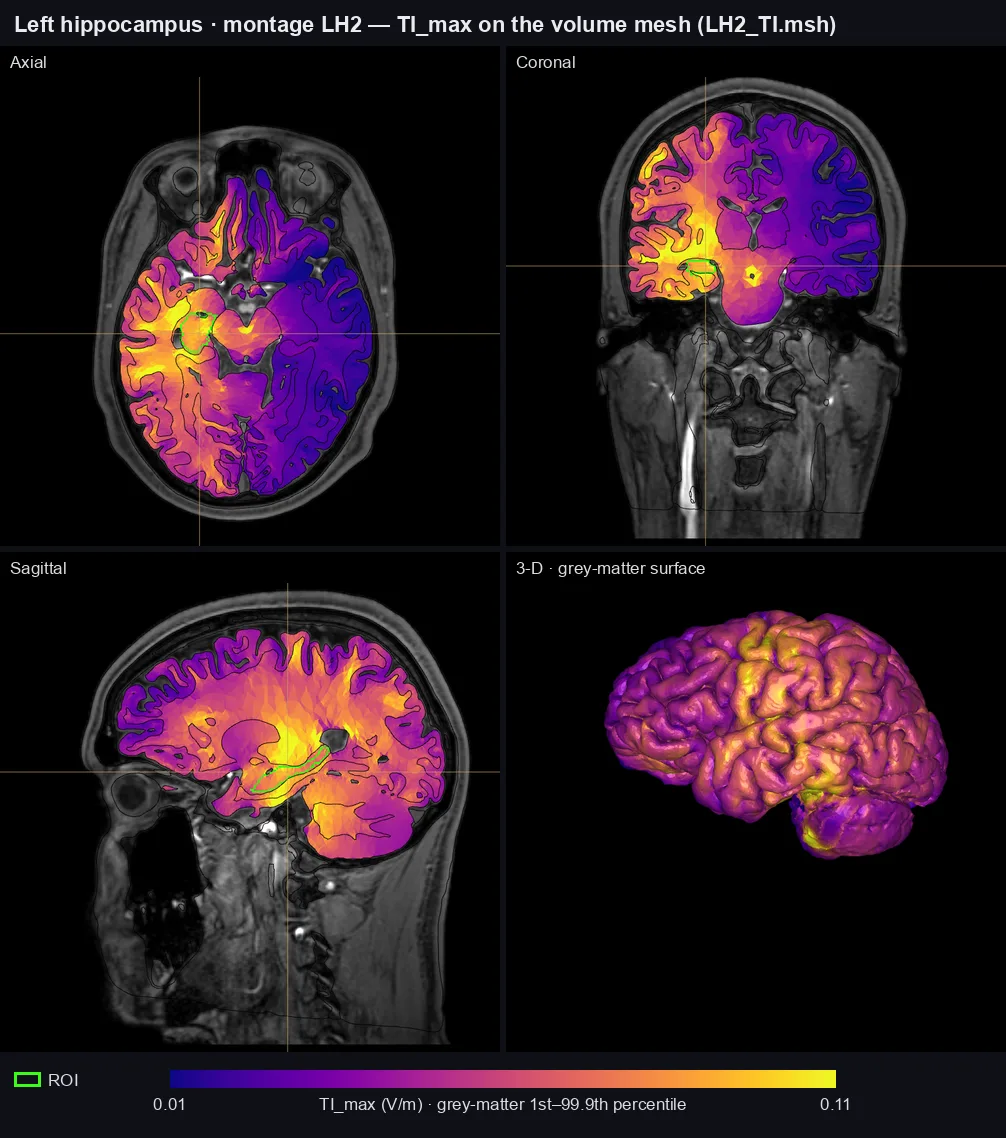 Volume mesh: filled cross-sections of
<montage>_TI.msh, grey matter in 3-D.
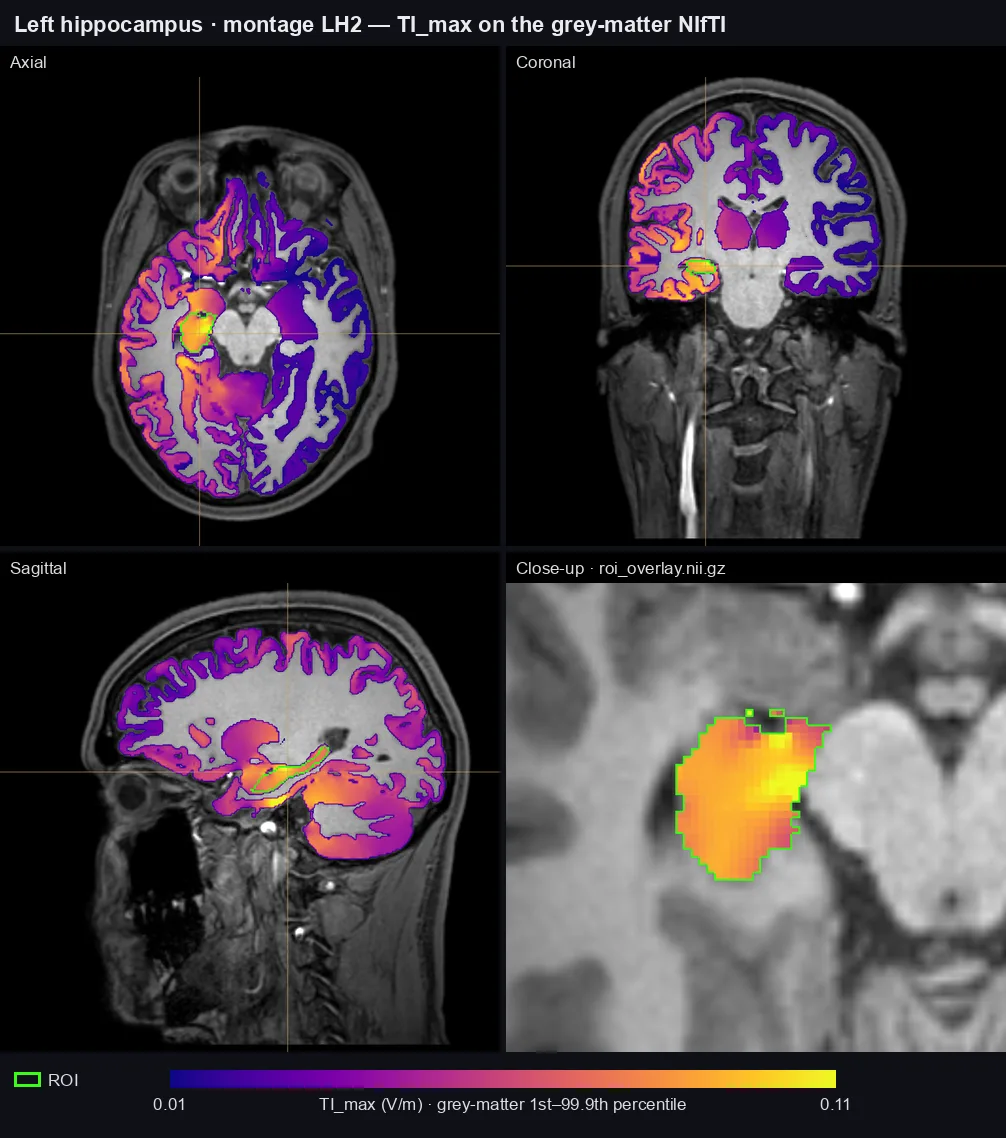 NIfTI: grey-matter
TI_max over the T1, and the analysis's roi_overlay.nii.gz close up.
Bilateral thalamus
Montage thalamus (F7–P7 and F8–P8, EEG10-10_Cutini_2011). Voxel analysis, Left- and Right-Thalamus combined into one ROI; the sagittal slice passes through the left thalamus.
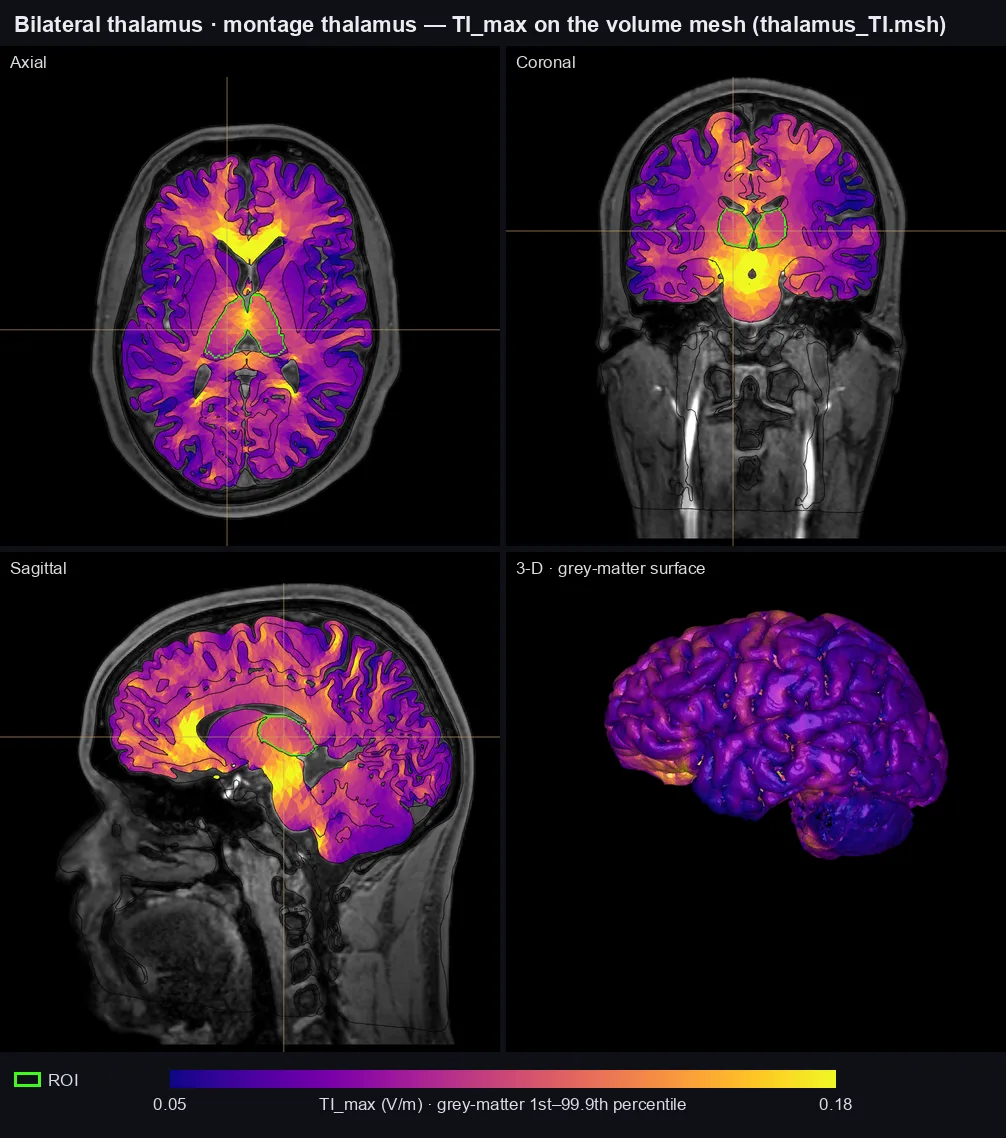 Volume mesh: filled cross-sections of
<montage>_TI.msh, grey matter in 3-D.
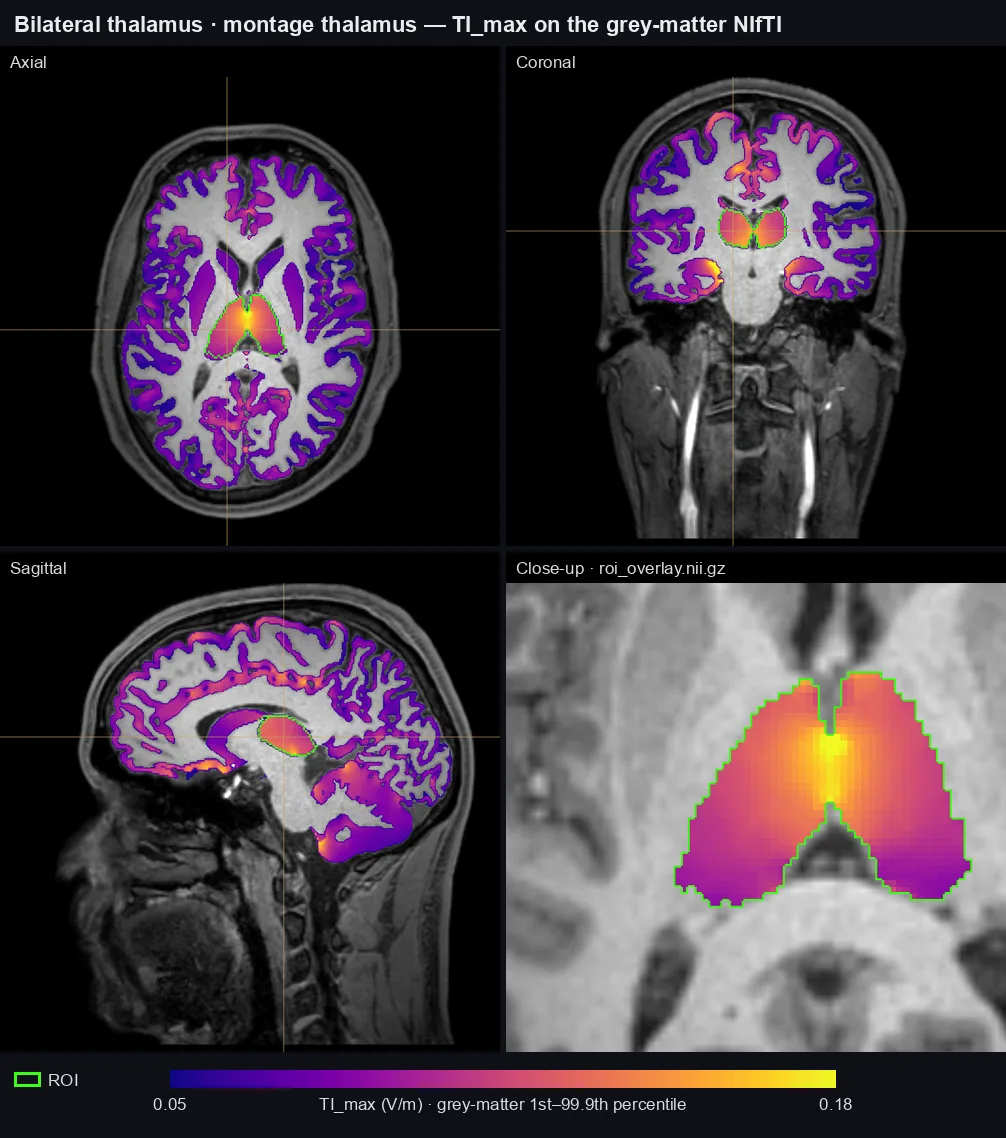 NIfTI: grey-matter
TI_max over the T1, and the analysis's roi_overlay.nii.gz close up.
Left insula
Montage L_Insula (F7–TP7 and FT7–P7, EEG10-10_UI_Jurak_2007). Mesh analysis on DK40 lh.insula; the outline drawn is the Harvard-Oxford left insular cortex, analysed in voxel space.
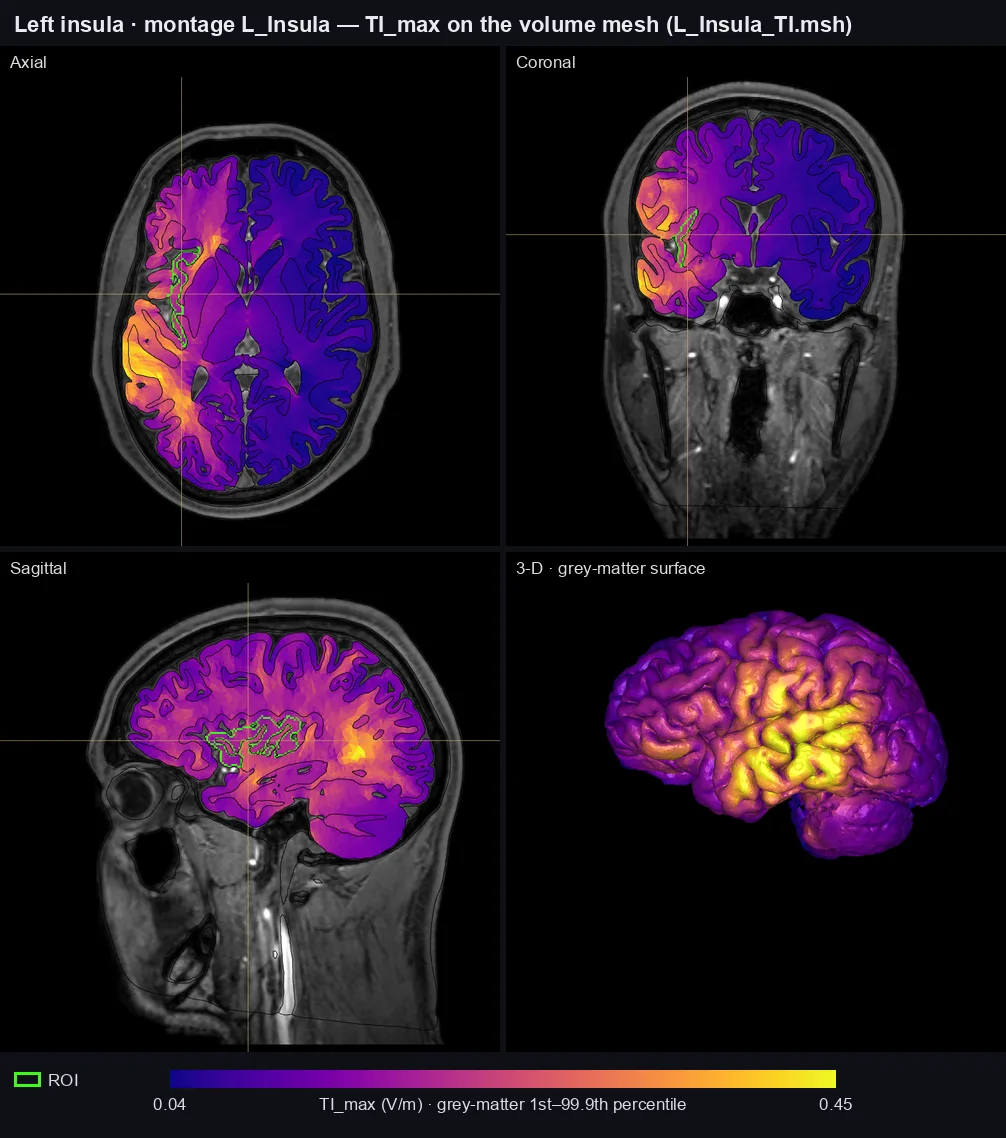 Volume mesh: filled cross-sections of
<montage>_TI.msh, grey matter in 3-D.
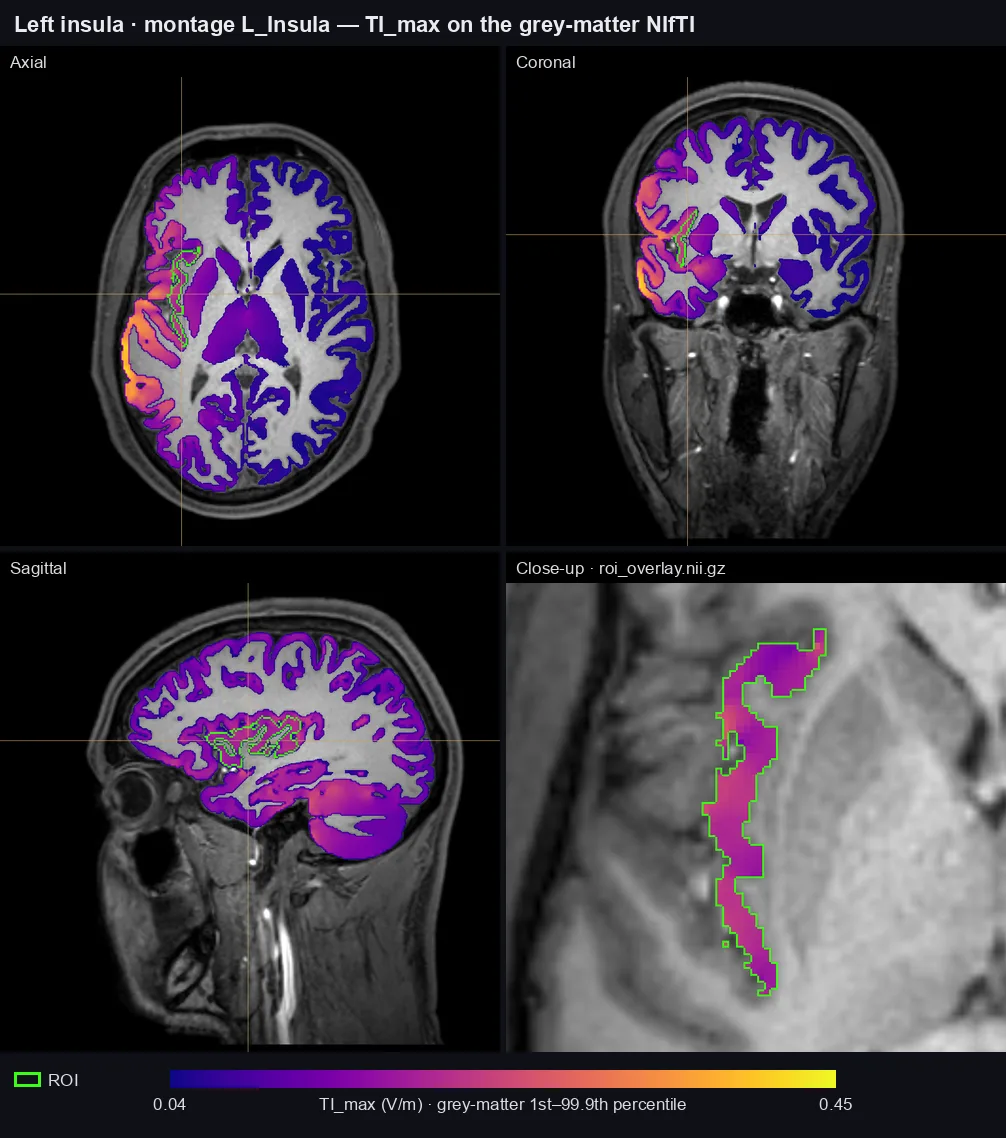 NIfTI: grey-matter
TI_max over the T1, and the analysis's roi_overlay.nii.gz close up.