Montage Visualizer
The Montage Visualizer (tit/tools/montage_visualizer.py) renders a PNG of an electrode montage on a template EEG-cap diagram. It runs automatically as part of every simulation and the result is written next to the simulation outputs and embedded in the simulation report.
Simulation Modes
Unipolar (standard TI) montages use 4 electrodes arranged in 2 channels. One image is written per montage:
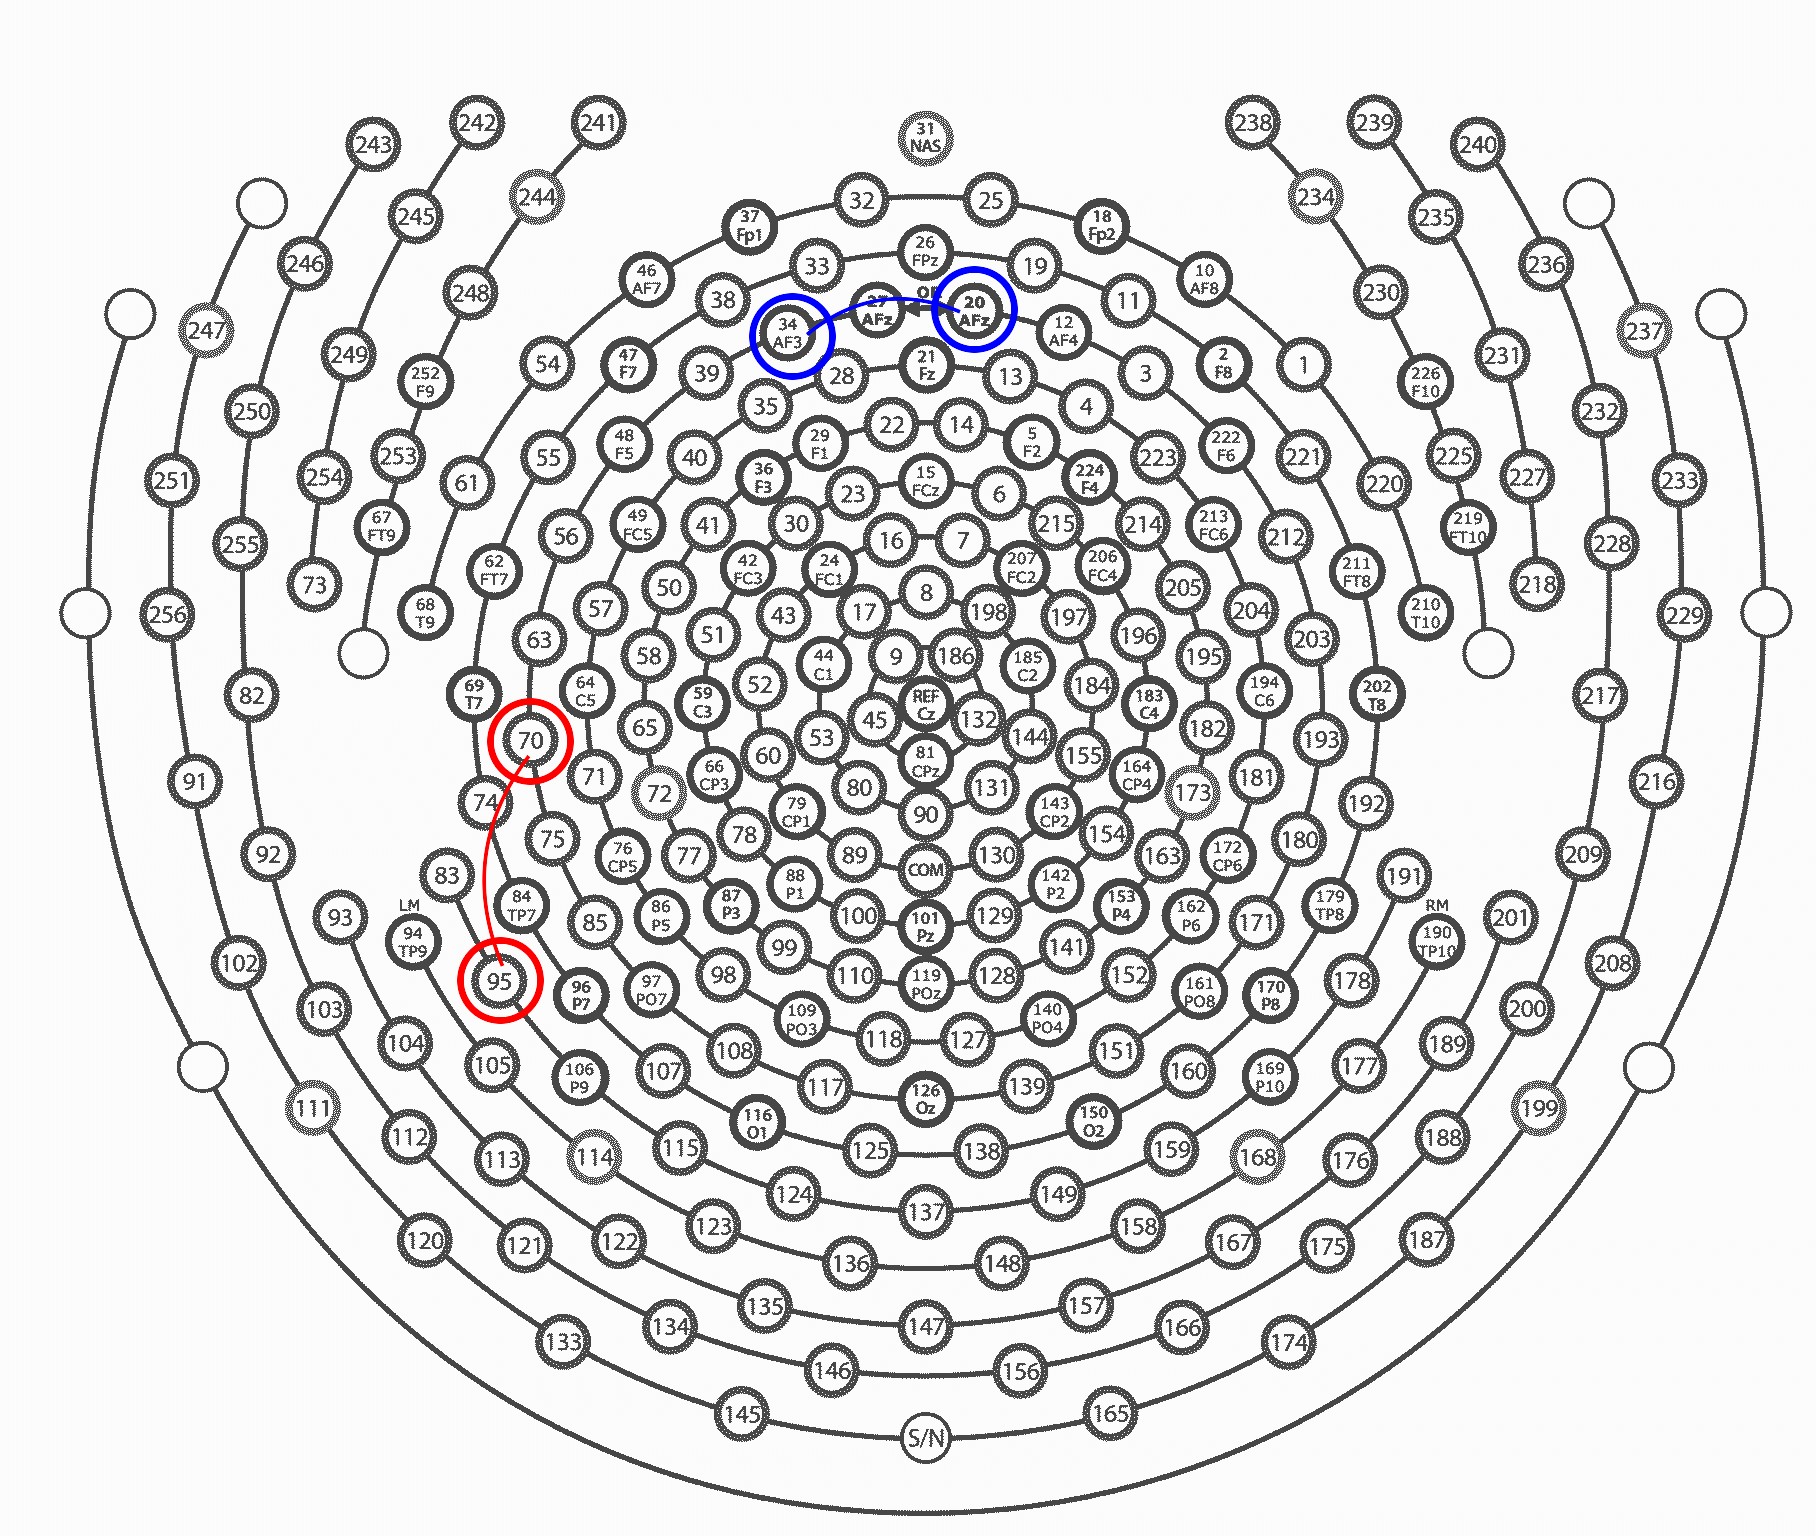
E034–E020 (channel 1A) and E095–E070 (channel 1B) on the GSN-HydroCel-185 net.
Multipolar (mTI) montages use 8 electrodes arranged in 4 channels and are drawn as a single combined image:
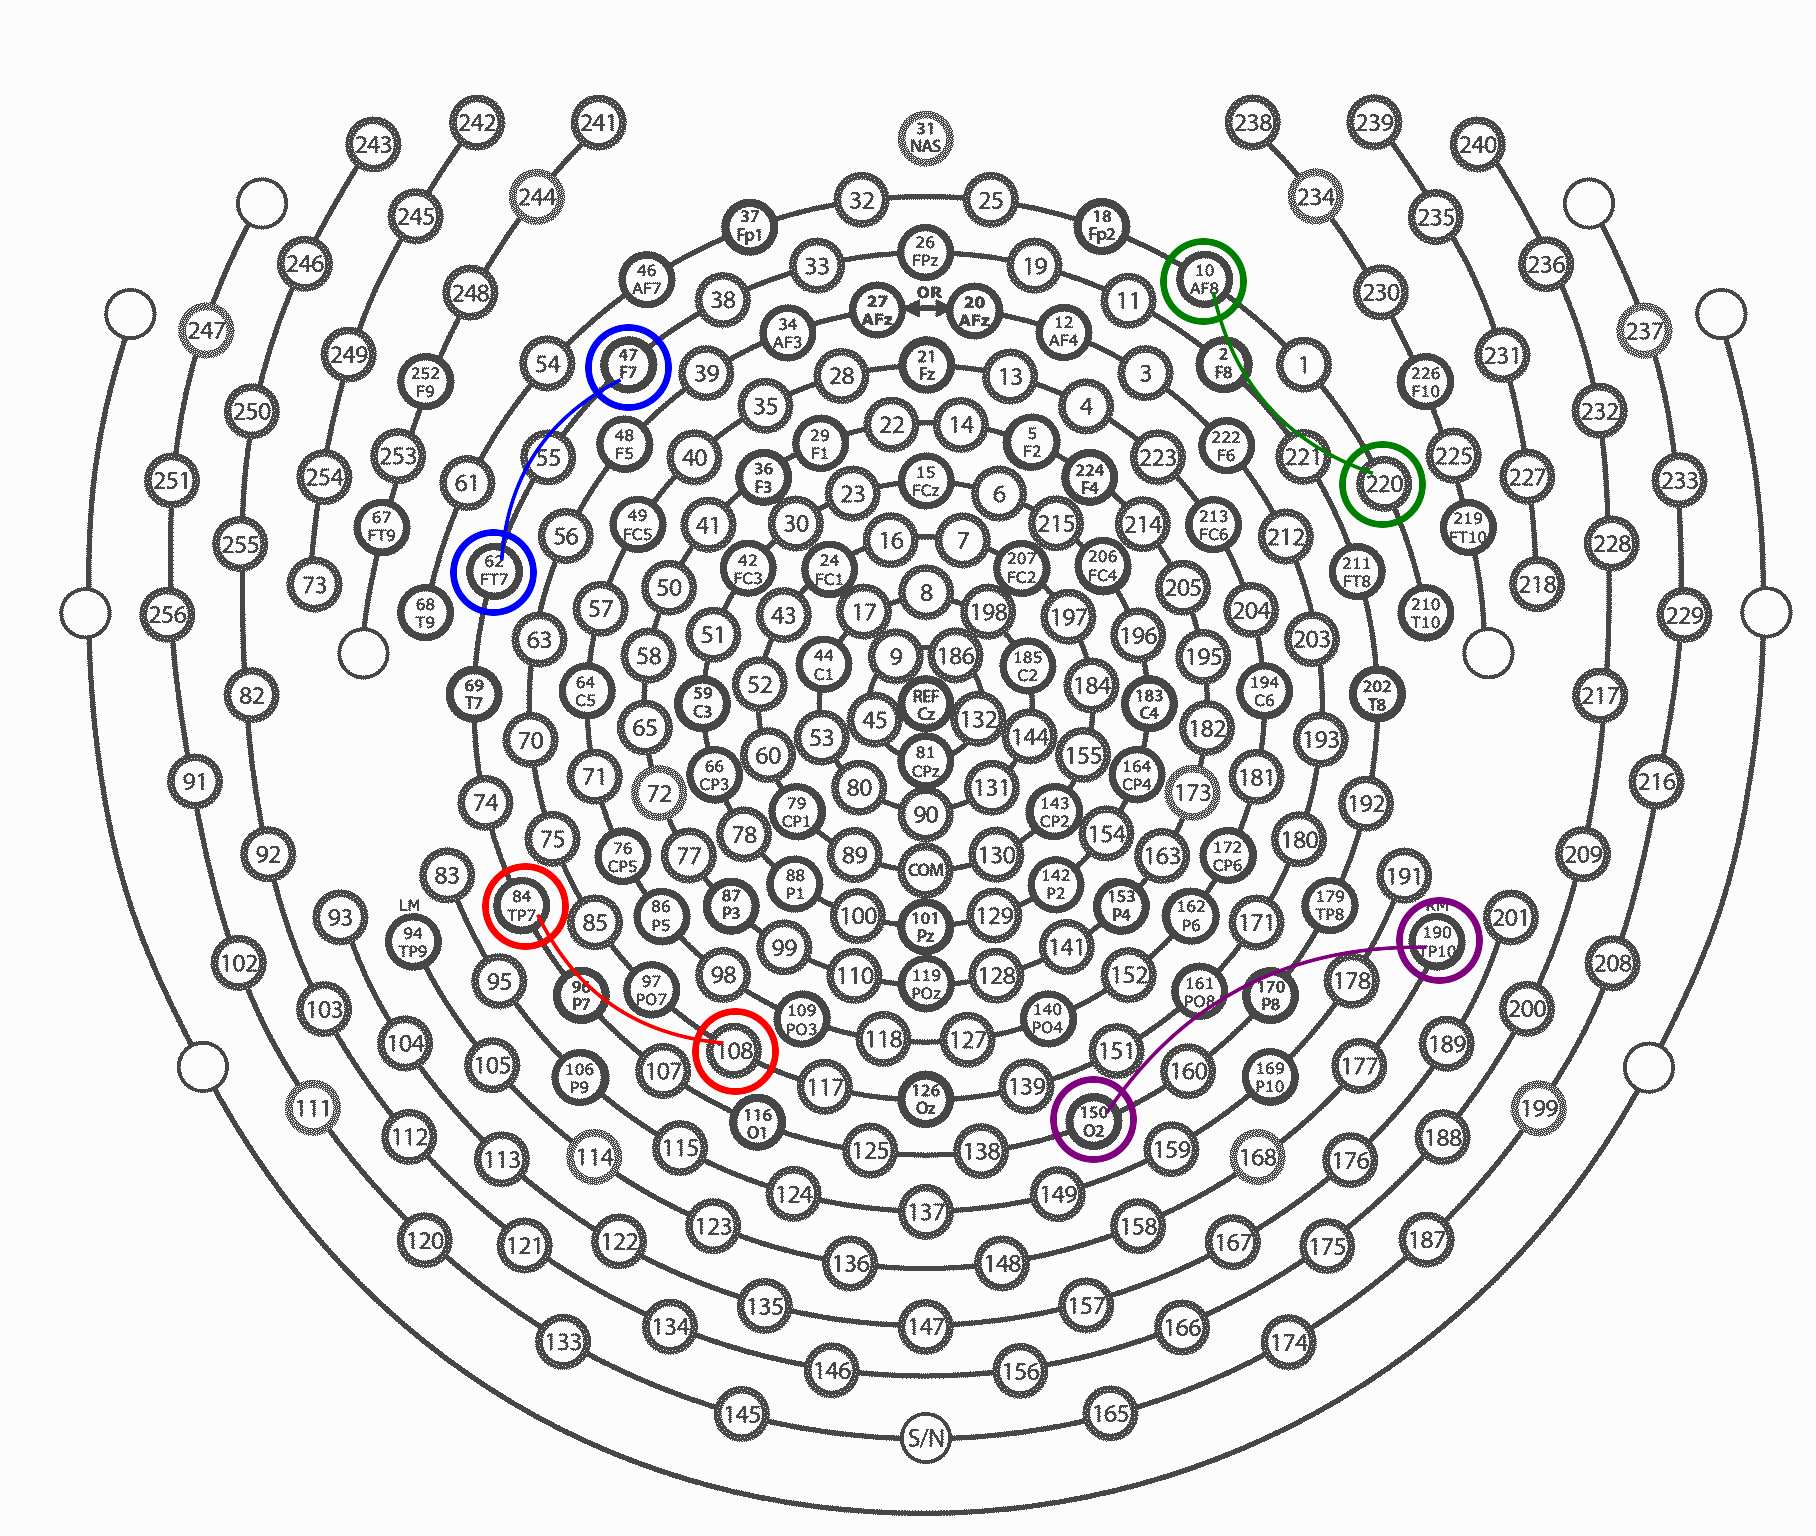
Two TI pairs: channels 1A/1B (blue/red) and 2A/2B (green/purple).
Output Location
derivatives/SimNIBS/sub-{ID}/Simulations/{montage}/
├── TI/montage_imgs/{montage}_highlighted_visualization.png     # unipolar
└── mTI/montage_imgs/combined_montage_visualization.png         # multipolar
Supported EEG Networks
Each EEG net is mapped onto one of two template diagrams in resources/amv/:
| Template | EEG nets |
|---|---|
| GSN-256 | GSN-HydroCel-185.csv, GSN-HydroCel-256.csv |
| 10-10 | EEG10-10_UI_Jurak_2007.csv, EEG10-10_Cutini_2011.csv, EEG10-20_Okamoto_2004.csv, EEG10-10_Neuroelectrics.csv |
Rendering is skipped (with a warning in the log; the simulation report then lists the channels without a cap figure) for easycap_BC_TMS64_X21.csv, EEG10-20_extended_SPM12, freehand XYZ montages and flex-search free-coordinate montages, because they have no template positions.
Visual Features
Electrode Rings
- Size: 100 × 100 px ring assets (
resources/amv/pair{N}ring.png), centred on the electrode position - Colours: one per channel, in order — blue, red, green, purple, orange, cyan, chocolate, violet (up to 8 channels)
Connection Arcs
- Style: quadratic Bézier curve between the two electrodes of a channel
- Direction: the arc bulges toward the centroid of the other channels’ electrodes (toward the cap centre when there is only one channel), so the two channels of a TI pair face each other
- Colour / width: matches the channel ring colour, 3 px stroke
Channel Legend
A colour key is drawn in the bottom-left corner with one row per channel. Rows are labelled by TI unit: Ch 1A / Ch 1B are the two channels of the first temporal-interference pair, Ch 2A / Ch 2B the second, and so on.
Calling It Directly
from tit.tools.montage_visualizer import visualize_montage

visualize_montage(
    montage_name="my_montage",
    electrode_pairs=[["E034", "E020"], ["E095", "E070"]],
    eeg_net="GSN-HydroCel-185.csv",
    output_dir="/mnt/my_project/derivatives/scratch",
    sim_mode="U",          # "U" = one image per montage, "M" = combined image
)
ImageMagick (convert) is required; it is included in the TI-Toolbox container.