
Jobs
Everything in TI-Toolbox v3 is a job: pre-processing, a simulation, a search, an analysis, a group statistic, a Blender export. A page never runs work in its own process, and its process is owned by the server. The Jobs page centralizes status and cancellation; run pages also show their submitted jobs in a live Terminal pane.
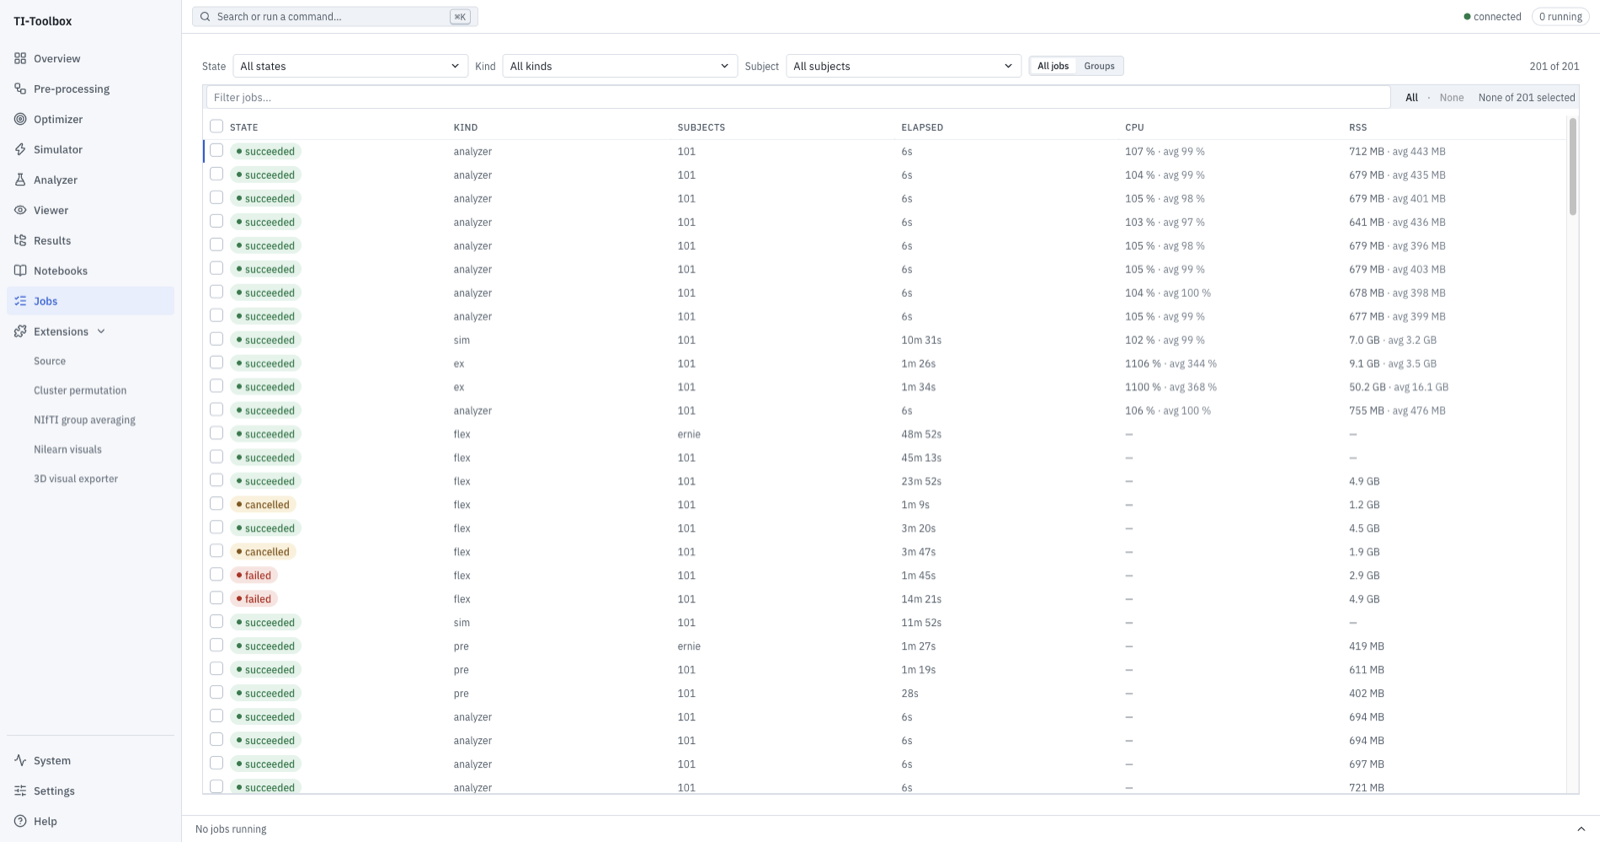 The Jobs page (⌘9). One row per job: state, kind, subjects, stage, elapsed time, CPU and memory.
Where jobs appear
- The Jobs rail at the bottom of every page — a one-line summary (“2 running”), expanded to a 260 px panel with ⌘J. Its tabs are Jobs and Host — Host being the quick glance at the machine (CPU, memory, disk, toolbox processes) without leaving the page you are on; the full-height version is the System page, pinned at the bottom of the rail above Settings. The Jobs tab is the table beside the selected job’s detail pane, split by a divider you can drag, double-click to reset, and which is remembered between sessions.
- The Jobs page (⌘9) — the full table with filters and a detail pane.
- A run page’s right pane — the Terminal tab shows the console of the job that page just submitted, beside the Scene tab.
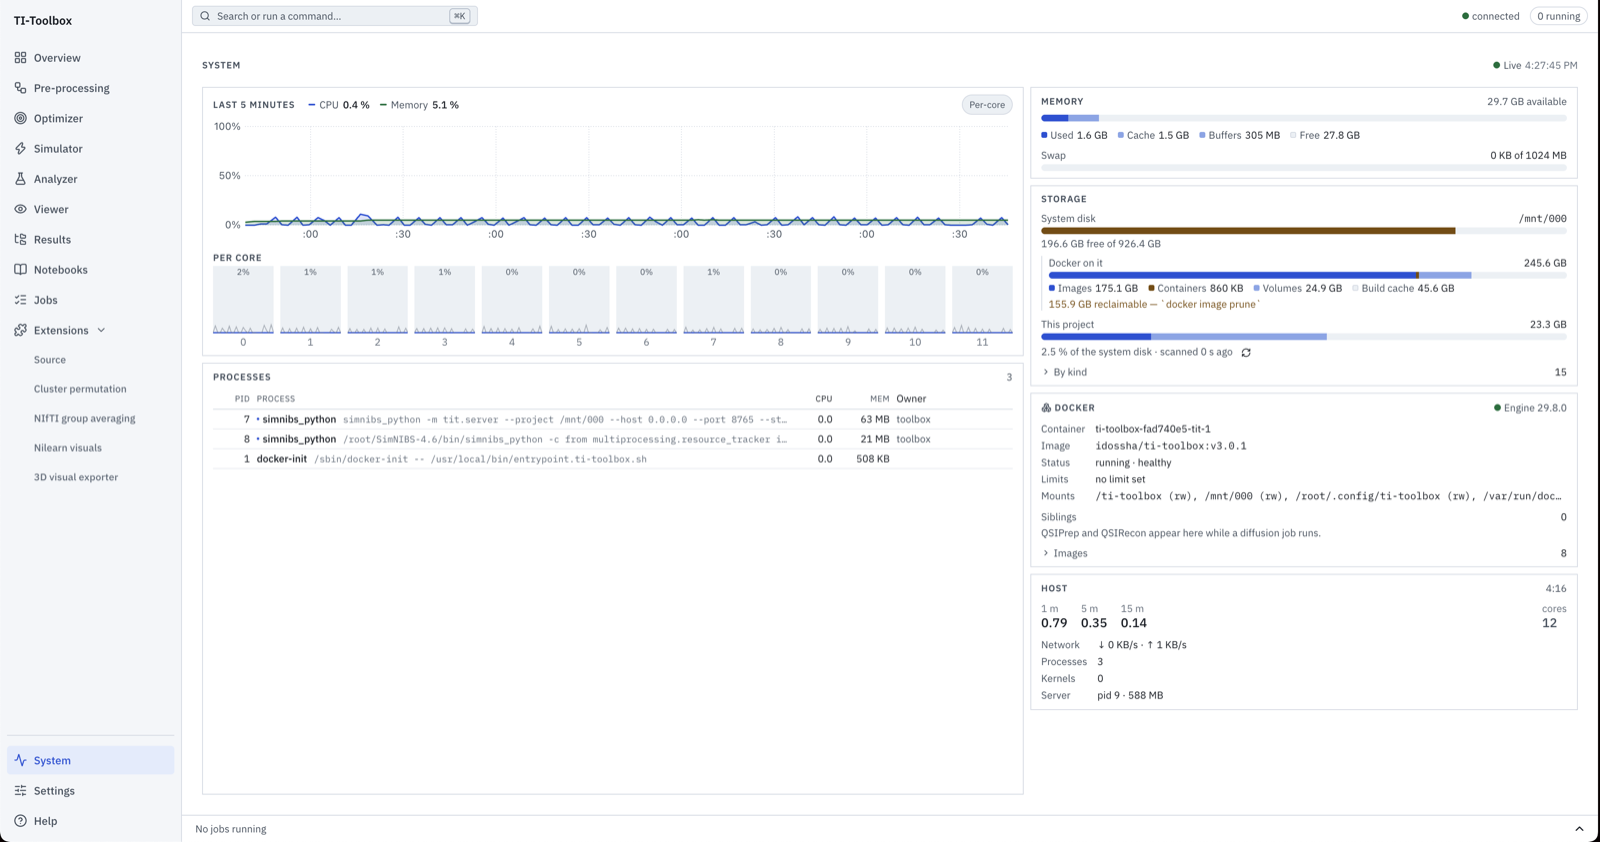 The System page: live CPU and memory, the processes in the container, disk use and the Docker engine.
How many CPUs jobs may use
All running jobs share one pool of CPUs: the CPU limit in Settings → Project → Execution, a percent of the cores available to the container (default 70 %, shown as e.g. “70 % · 7 of 10 cores”). It leaves headroom for your computer; raise it for faster searches. A job that would exceed what is left waits (“waiting for budget”) until others finish. A change applies to jobs started afterwards — running jobs keep what they were given. Scripts and notebooks honour the same setting.
The table
Filters for state, kind and subject, a free-text filter, and a grouping toggle: the same list rendered either flat (one row per job) or as a tree of group → subject → stage. A batch you submitted from a run page, and a whole pipeline run, are each one group, so they can be watched and cancelled as one thing.
| Column | Notes |
|---|---|
| State | queued · running · succeeded · failed · cancelled · skipped · lost |
| Kind | pre · sim · flex · flex_adaptive · flex_pareto · ex · mex · analyzer · source · stats · nilearn · nifti_average · blender |
| Subjects | Every subject the job covers |
| Stage | The runner’s own current stage and its percentage, e.g. DICOM conversion · 40 % |
| Elapsed / CPU / RSS | Live from the server, not estimated |
The detail pane
Select a row — in the panel or on the page — and the pane on the right opens with:
- Summary — kind, subjects, group, created, elapsed, CPU, RSS and exit code, plus (on the full page) the last 40 lines of the console.
- Raw log — the whole log: streamed over
/ws/jobs, backfilled over REST, falling back to the log file on disk for a job whose events the server no longer holds. Level colouring, a filter, follow-tail and Clear are in the console’s own toolbar. - Artifacts — what the job wrote, with Open (into the Viewer) and Reveal. A generated report is one of these; browse reports in Results.
- Actions — Stop, Rerun, Force and Delete, in the pane’s header row.
When a job fails, the pane names which kind of failure it was rather than only printing a
traceback: preflight, lock_wait, budget_wait, runner_failed, oom_suspected, cancelled,
skipped, lost, docker_unavailable — plus the last 20 lines of the log.
Clear on any console is a per-view watermark. It hides what you have already read in that view; it never deletes a server event and never truncates a log file on disk.
Batches, groups and parallelism
A run page submits its whole table as one request (POST /api/jobs/groups) carrying one
template config plus per-subject overrides, and gets one group_id back. Two consequences worth
knowing:
- A table that mixes two job kinds becomes one group per kind, and the page says so — “Queued 3 searches in 2 groups (ex, flex)” — rather than implying an atomic batch.
- One job per product at a time. Pre-processing, Simulator, Optimizer and Analyzer each run one job at a time, so a multi-subject run processes its subjects one after another, and a second run of the same product waits for the first (“waiting for simulator”). Jobs of different products can run together within the CPU limit. There is no setting for this.
Notifications when a job finishes
The desktop app shows a system notification when a job it watched run finishes or fails, for example Simulation finished — sub-101 · montage L_Insula. Each subject of a multi-subject run notifies on its own; they arrive one at a time, since a product runs one job at a time. Cancelled jobs, and jobs that had already finished before the app opened, do not notify. Clicking a notification brings TI-Toolbox to the front.
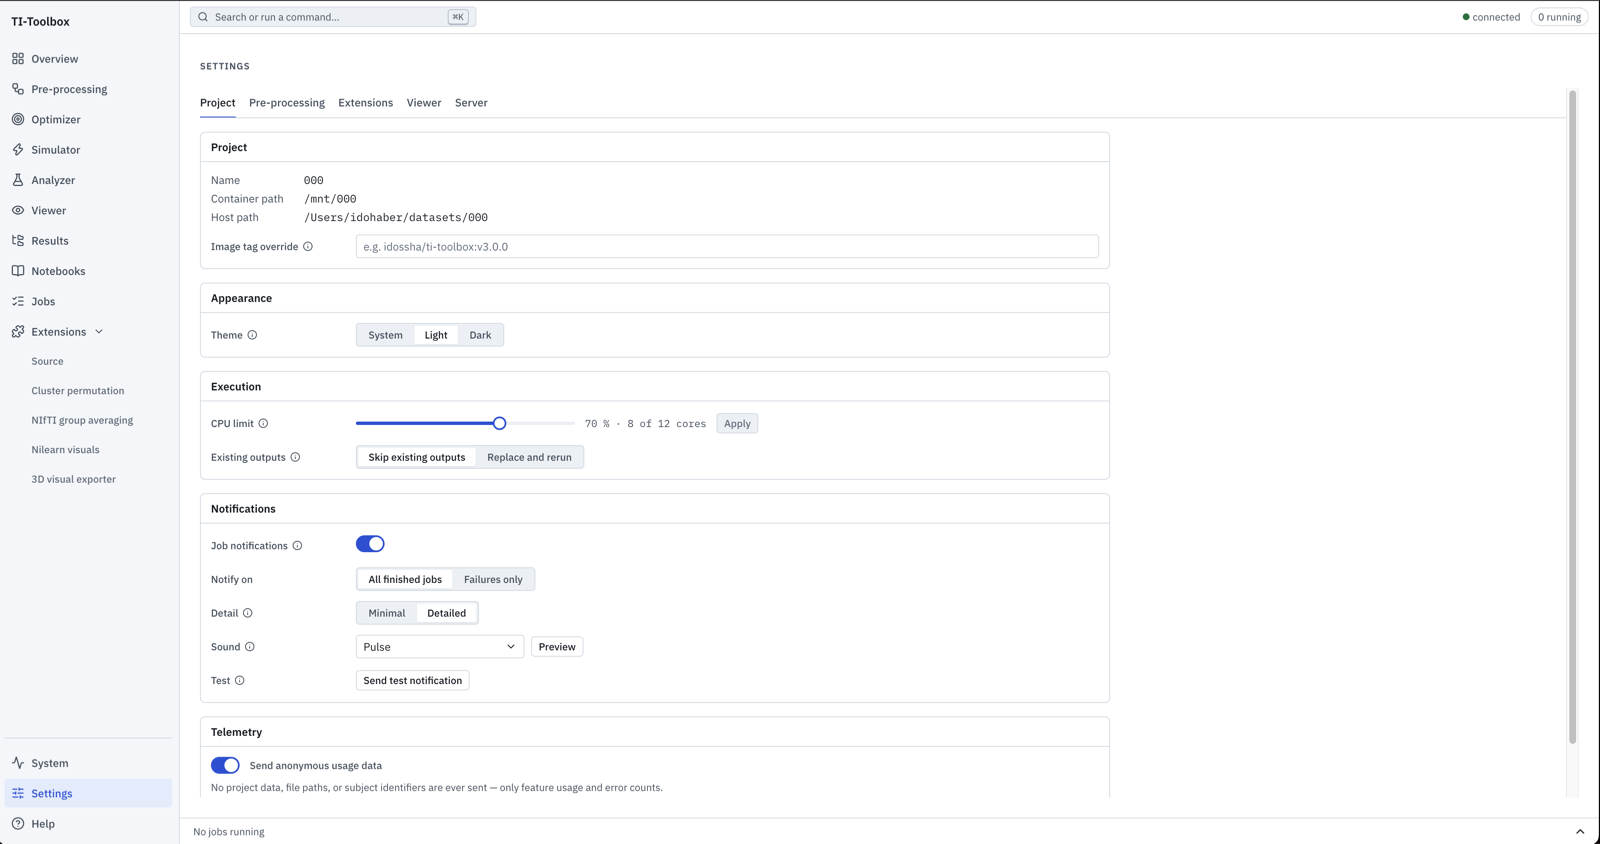 Settings → Project holds the CPU limit (Execution) and the notification choices.
Settings → Project → Notifications turns them on or off (default on) and chooses:
- Notify on — all finished jobs (default) or failures only;
- Detail — Detailed (default) adds the subject and the montage or target, Minimal shows only the title;
- Sound — one of TI-Toolbox’s own short sounds (Pulse, the default, Chime or Tick; a failure plays the same sound lower), System default (the system’s notification sound) or None. Preview beside it plays the selected TI-Toolbox sound. The sound plays whether or not TI-Toolbox is in front.
Send test notification shows a sample banner with the current detail and sound, and says right under the button whether it was shown or why not.
On macOS the first notification asks for permission; if none appear, allow TI-Toolbox in System Settings → Notifications. A browser session has no notifications.
Developers running a checkout (bash loader.sh --dev --desktop or npm run dev) use the
Electron.app from desktop/node_modules, which npm installs without a valid code signature. macOS
silently refuses notifications from it and never lists it in System Settings. npm install
re-signs it ad hoc now; for an existing checkout, quit the app and run
npm --prefix desktop run sign:dev-electron once, then allow Electron in
System Settings → Notifications when asked.
Server restart
A server restart deliberately interrupts work; it does not resume or automatically resubmit jobs. Startup reconciliation marks queued jobs failed, with an interrupted-before-start reason. For a running job, it stops any verified surviving runner process tree and associated job containers, then marks the job failed as interrupted. If the runner has already exited and its saved events record a real exit, the job instead retains that actual succeeded or failed outcome. These transitions are persisted before the server accepts new requests.
Review the job’s outcome and outputs, then explicitly submit a new run if needed. Reopening a browser or reconnecting a client to a server that stayed running is different from restarting the server; client disconnection alone does not trigger this reconciliation.
Replacing existing outputs
Existing outputs require a fresh confirmation each time you run. Replace and rerun is the one control for replacing outputs, and it is always available. Skip keeps existing results and runs only missing work; Cancel submits nothing. API submissions are checked too and still require explicit overwrite confirmation.
A pipeline’s Skip pipeline option submits no jobs: its dependent steps cannot be partially skipped safely. Replacement is unavailable when dependent outputs cannot yet be previewed.