Cluster-Based Permutation Testing
The Cluster-Based Permutation Testing extension performs non-parametric statistical analysis to identify brain regions with significant relationships between temporal interference (TI) stimulation fields and behavioral/clinical outcomes. This method provides robust control of family-wise error rates for both group comparison (binary outcomes) and correlation analysis (continuous outcomes).
Import and export participant rows
Use Import CSV/TSV, Export CSV, or Export TSV below the Subjects header. Export the current table for an editable template. The required header and an example CSV row are:
subject_id,simulation_name,response,effect_size,weight
101,L_Insula,1,,1
For TSV, use tabs instead of commas. Columns may be reordered, but all headers must be present
with exactly these names. Subject IDs omit sub-; simulation names match the project catalog.
response is 0 or 1. effect_size may be blank or a finite number; weight may be blank or a positive finite number. Quoted fields, embedded separators, UTF-8 BOM and Windows line endings are supported.
An import replaces the table only after every row validates. A malformed file leaves existing
rows unchanged. Import checks table structure and values; dataset files are checked by the job workflow.
Key Features
- Dual Analysis Modes: Group comparison (responders vs non-responders) and correlation analysis (continuous outcomes)
- Non-parametric Statistics: No assumptions about data distribution
- Family-wise Error Control: Cluster-level correction for multiple comparisons
- BIDS Integration: Automatic data discovery and organization
- Flexible Study Designs: Binary classification or dose-response relationships
- Parallel Processing: Multi-core support for fast computation
- Comprehensive Output: Statistical maps, cluster analysis, and detailed reports
Results produced with v2.2.3 – v2.5.0 should be re-run. Three defects in the cluster machinery were fixed in v3.0.0: opposite-sign clusters that touch were merged into one, the permutation null for two-sided and left-tailed tests was built with the least extreme cluster instead of the most extreme one, and the sampled p-value could return exactly 0. Right-tailed (
alternative="greater") analyses are unaffected. See the maintainer note release notes (SCI-01, SCI-04, SCI-06) for how to tell whether a given result is affected and what changes.
Theoretical Background
Why Cluster-Based Permutation Testing?
Traditional voxelwise statistical tests performed at each brain voxel create a massive multiple comparisons problem. With ~1,000,000 voxels in a typical brain analysis, even a 5% false positive rate would yield 50,000 false discoveries.
Cluster-based permutation testing addresses this by:
- Performing voxelwise statistics (t-values or correlations)
- Forming clusters of adjacent significant voxels of the same sign
- Using cluster statistics (mass or size) instead of individual voxels
- Building null distributions through data permutations
- Controlling family-wise error at the cluster level
Analysis Methods
Group Comparison (Binary Outcomes)
Traditional Approach: Compare electric field distributions between responders and non-responders.
- Statistical Test: Two-sample t-test at each voxel
- Permutation Strategy: Randomly reassign subjects to responder/non-responder groups
- Null Hypothesis: No difference in electric field strength between groups
- Use Case: Clinical trials with binary outcomes (response vs non-response)
Correlation Analysis (Continuous Outcomes)
ACES Approach: Identify brain regions where electric field strength correlates with continuous outcome measures.
- Statistical Test: Pearson/Spearman correlation at each voxel
- Permutation Strategy: Randomly shuffle outcome measures across subjects
- Null Hypothesis: No association between electric field strength and outcome
- Use Case: Dose-response studies with continuous measures (effect sizes, behavioral scores)
Method Implementation
Both methods follow the Maris & Oostenveld (2007) framework with method-specific adaptations:
Group Comparison Workflow:
- Voxelwise Testing: Compute t-statistics comparing group means
- Cluster Formation: Threshold at p < cluster_threshold to form clusters
- Cluster Statistics: Calculate mass (signed sum of t-values within a sign-homogeneous cluster) or size (voxel count)
- Permutation Testing: Randomly reassign subjects to groups 1,000+ times
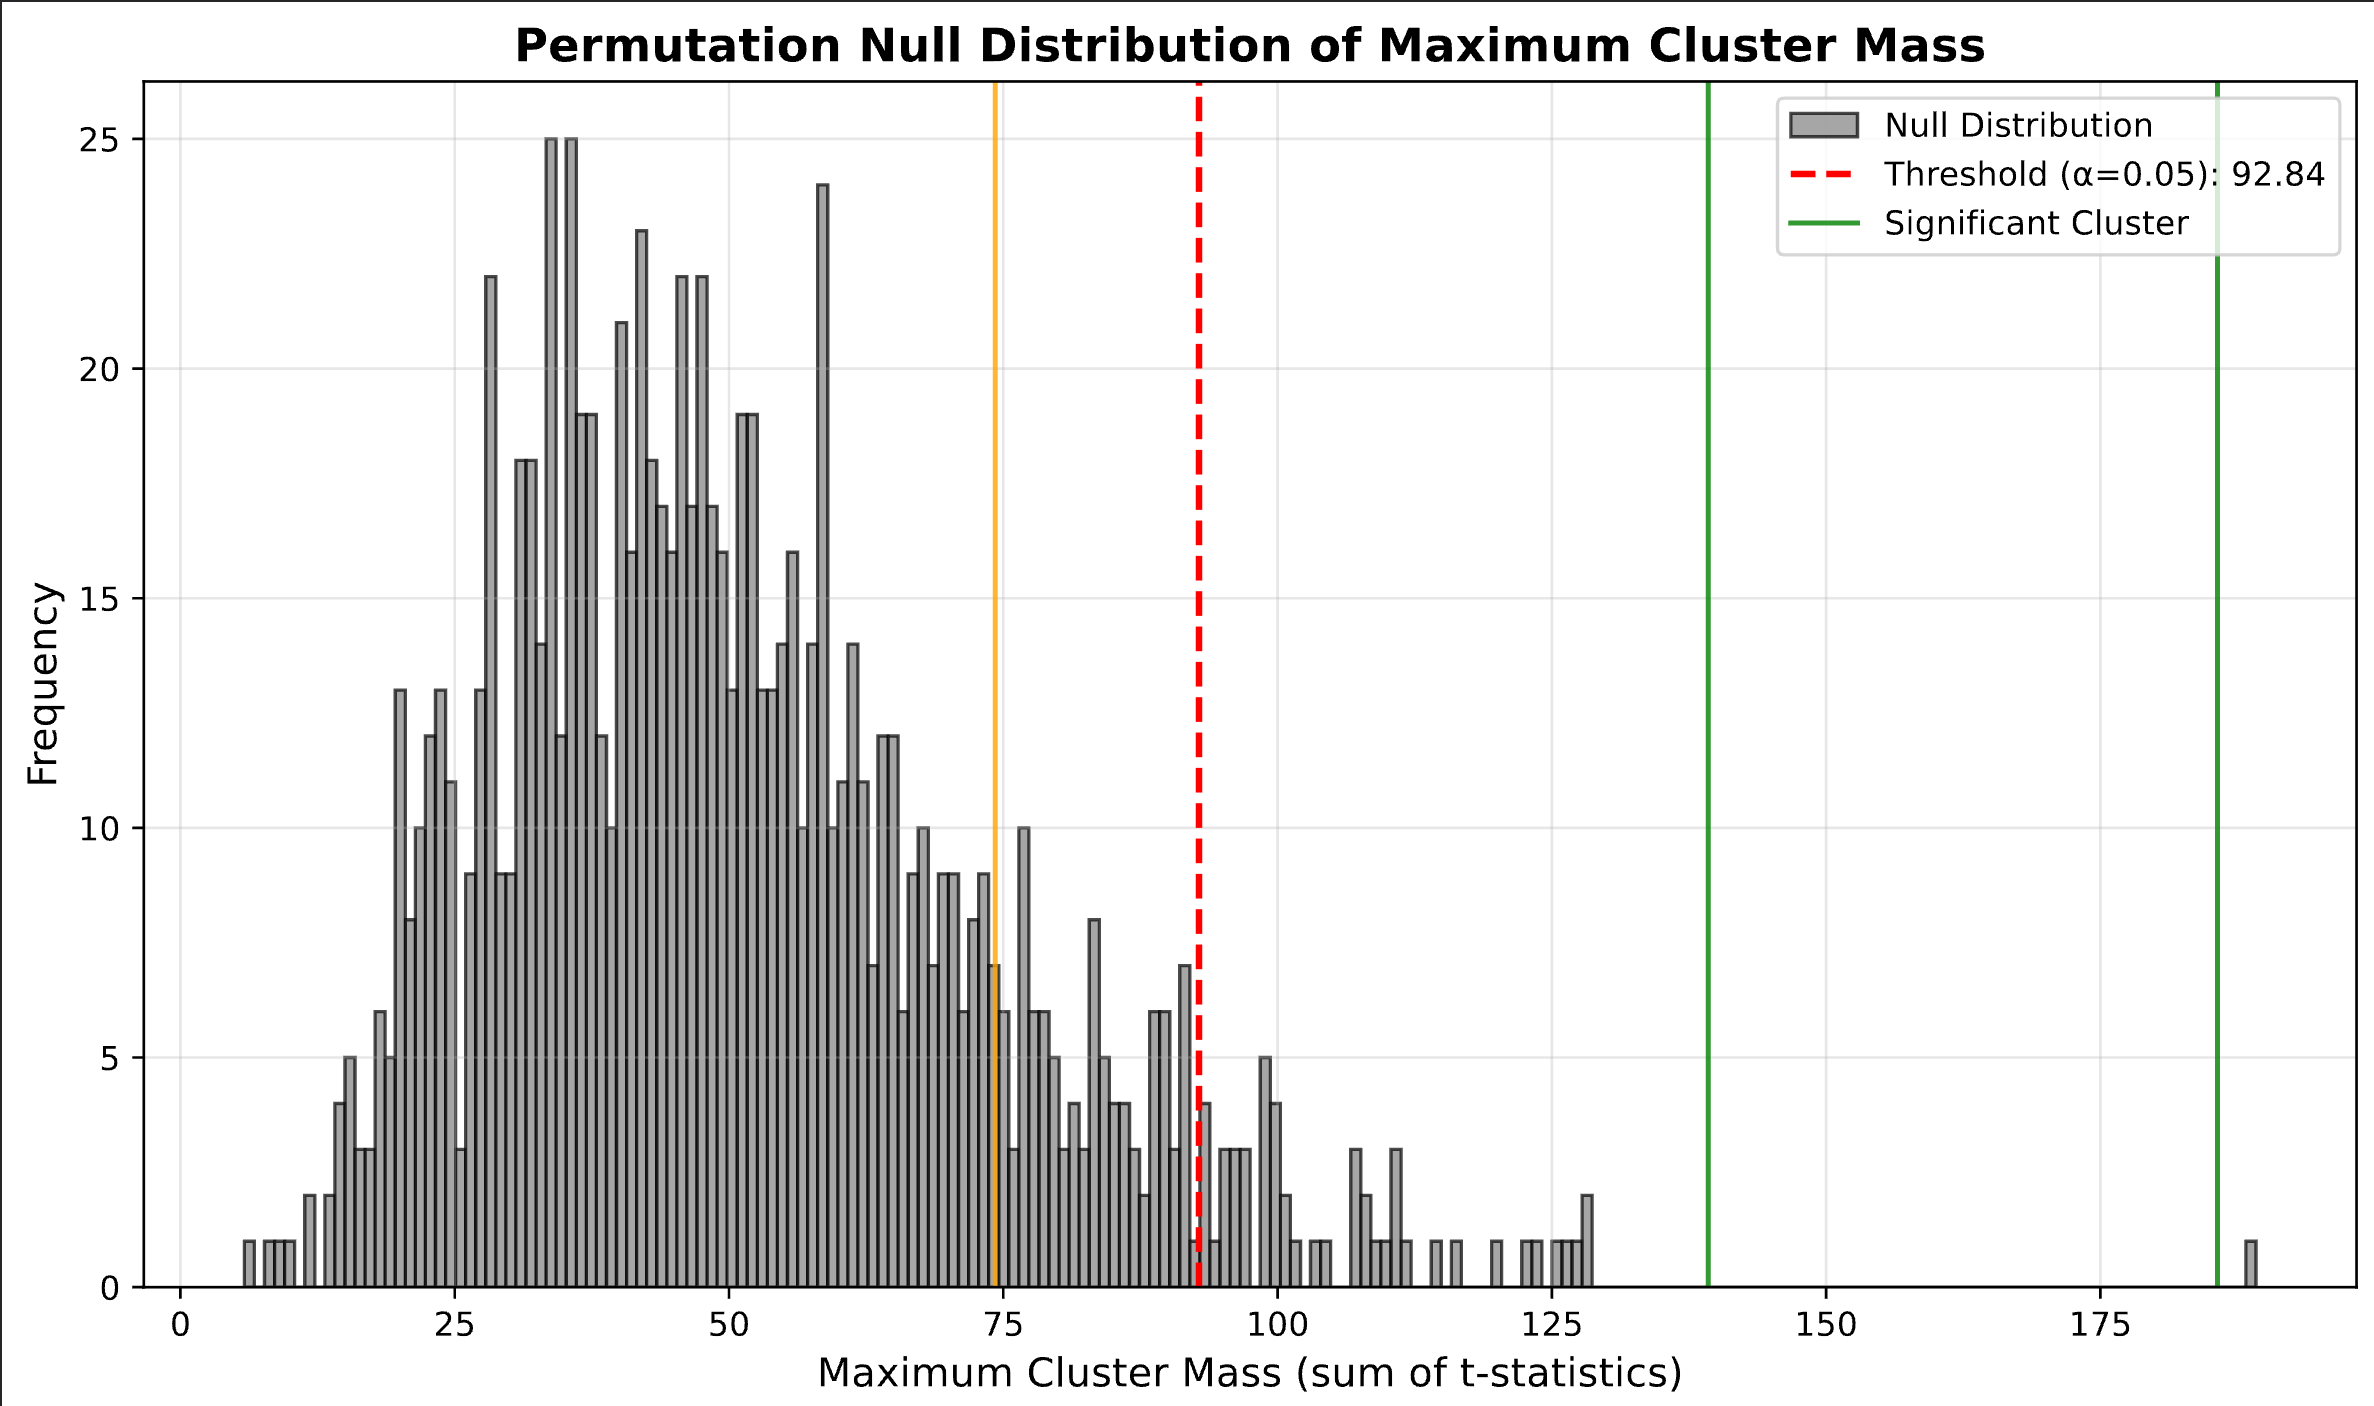
- Null Distribution: Build distribution of maximum cluster statistics under null
- Significance Testing: Compare observed clusters to null distribution
Correlation Analysis Workflow:
- Voxelwise Testing: Compute correlation coefficients between E-field and outcome
- Cluster Formation: Threshold at p < cluster_threshold to form clusters
- Cluster Statistics: Calculate mass (signed sum of t-values within a sign-homogeneous cluster) or size (voxel count)
- Permutation Testing: Randomly shuffle outcome measures across subjects 1,000+ times
- Null Distribution: Build distribution of maximum cluster statistics under null
- Significance Testing: Compare observed clusters to null distribution
User Interface
Analysis Mode Selection
Choose between two analysis approaches:
- Classification Mode: Binary group comparison (responders vs non-responders)
- Correlation Mode: Continuous outcome analysis (dose-response relationships)
Subject Configuration
Configure subjects based on the selected analysis mode:
Classification Mode
- Subject-Simulation Pairs: Link each subject to their TI simulation
- Group Classification: Assign subjects as “Responder” or “Non-Responder”
- CSV Import/Export: Batch configuration with response labels
Correlation Mode
- Subject-Simulation Pairs: Link each subject to their TI simulation
- Effect Size Input: Enter continuous outcome measures for each subject
- Optional Weights: Subject-specific weights (e.g., sample sizes)
- CSV Import/Export: Batch configuration with effect sizes and weights
Statistical Parameters
Classification Mode
- Test Type: Unpaired (independent groups) or paired (repeated measures)
- Alternative Hypothesis: Two-sided, greater than, or less than
- Cluster Threshold: p-value for initial cluster formation (default: 0.05)
- Cluster Statistic: “Mass” (t-value sum) or “Size” (voxel count)
- Significance Level: cutoff for the permutation null distribution (default: 0.05)
- Permutations:
n_permutations(default: 1000);n_jobs(default: -1, the global CPU limit from Settings; larger values are capped at it) - Group labels:
group1_name/group2_name(defaultsResponders/Non-Responders)
Correlation Mode
- Correlation Type: Pearson (parametric) or Spearman (non-parametric)
- Use Weights: Enable/disable weighted correlation analysis
- Cluster Threshold: p-value for initial cluster formation (default: 0.05)
- Cluster Statistic: “Mass” (t-value sum) or “Size” (voxel count)
- Significance Level: cutoff for the permutation null distribution (default: 0.05)
Analysis Space
Both modes accept analysis_space = "mni" (volumetric, default) or "fsaverage" (surface-based, using the per-simulation fsaverage projections; fsaverage_field default TI_max, fsaverage_spacing default 5).
Workflow Examples
Classification Analysis: Responder vs Non-Responder
- Open tool: enable Cluster permutation in Settings → Extensions, then select it under Extensions in the sidebar
- Select Mode: Choose “Classification” mode
- Configure Subjects:
- Subject 001: Simulation “HIPP_L”, Responder
- Subject 002: Simulation “HIPP_L”, Non-Responder
- … (10+ subjects total)
- Set Parameters:
- Test type: Unpaired
- Permutations: 1,000
- Cluster statistic: Mass
- Run Analysis: Processing time depends on dataset size, permutations, and CPU cores
Correlation Analysis: Dose-Response Relationship
- Open tool: enable Cluster permutation in Settings → Extensions, then select it under Extensions in the sidebar
- Select Mode: Choose “Correlation” mode
- Configure Subjects:
- Subject 001: Simulation “HIPP_L”, Effect Size: 0.85
- Subject 002: Simulation “HIPP_L”, Effect Size: 0.72
- … (10+ subjects with continuous outcome measures)
- Set Parameters:
- Correlation type: Pearson
- Use weights: Enabled (if applicable)
- Permutations: 1,000
- Cluster statistic: Mass
- Run Analysis: Processing time depends on dataset size, permutations, and CPU cores
Output Structure
Results are saved to derivatives/ti-toolbox/stats/{analysis_type}/{analysis_name}/:
Classification Output
group_comparison/hippocampus_responders_vs_nonresponders/
├── significant_voxels_mask.nii.gz          # Binary mask of significant voxels
├── pvalues_map.nii.gz                      # P-value map (-log10 scale)
├── average_responders.nii.gz               # Group average for responders
├── average_non_responders.nii.gz           # Group average for non-responders
├── difference_map.nii.gz                   # Responders - Non-responders
├── tvalues_map.nii.gz                      # T-statistic map
├── permutation_null_distribution.pdf       # Null distribution visualization
├── cluster_size_mass_correlation.pdf       # Cluster statistics
├── analysis_summary.txt                    # Complete statistical report
├── permutation_details.txt                 # Detailed permutation log
├── analysis_TIMESTAMP.log                  # Processing log
└── config.json                             # Analysis configuration
Correlation Output
correlation/hippocampus_effect_size_correlation/
├── significant_voxels_mask.nii.gz          # Binary mask of significant voxels
├── pvalues_map.nii.gz                      # P-value map (-log10 scale)
├── rvalues_map.nii.gz                      # Correlation coefficient map
├── tvalues_map.nii.gz                      # T-statistic map
├── permutation_null_distribution.pdf       # Null distribution visualization
├── cluster_size_mass_correlation.pdf       # Cluster statistics
├── analysis_summary.txt                    # Complete statistical report
├── permutation_details.txt                 # Detailed permutation log
├── analysis_TIMESTAMP.log                  # Processing log
└── config.json                             # Analysis configuration
Example classification findings (illustrative):
- Significant cluster in left hippocampus (p = 0.008, 1,245 voxels)
- Significant cluster in right hippocampus (p = 0.012, 987 voxels)
- Trend-level cluster in left entorhinal cortex (p = 0.067, 615 voxels)
Example correlation findings (illustrative):
- Significant cluster in left hippocampus (r = 0.72, p = 0.003, 1,156 voxels)
- Significant cluster in right hippocampus (r = 0.68, p = 0.007, 892 voxels)
- Dose-response relationship between E-field strength and clinical improvement
Example MNI-space output
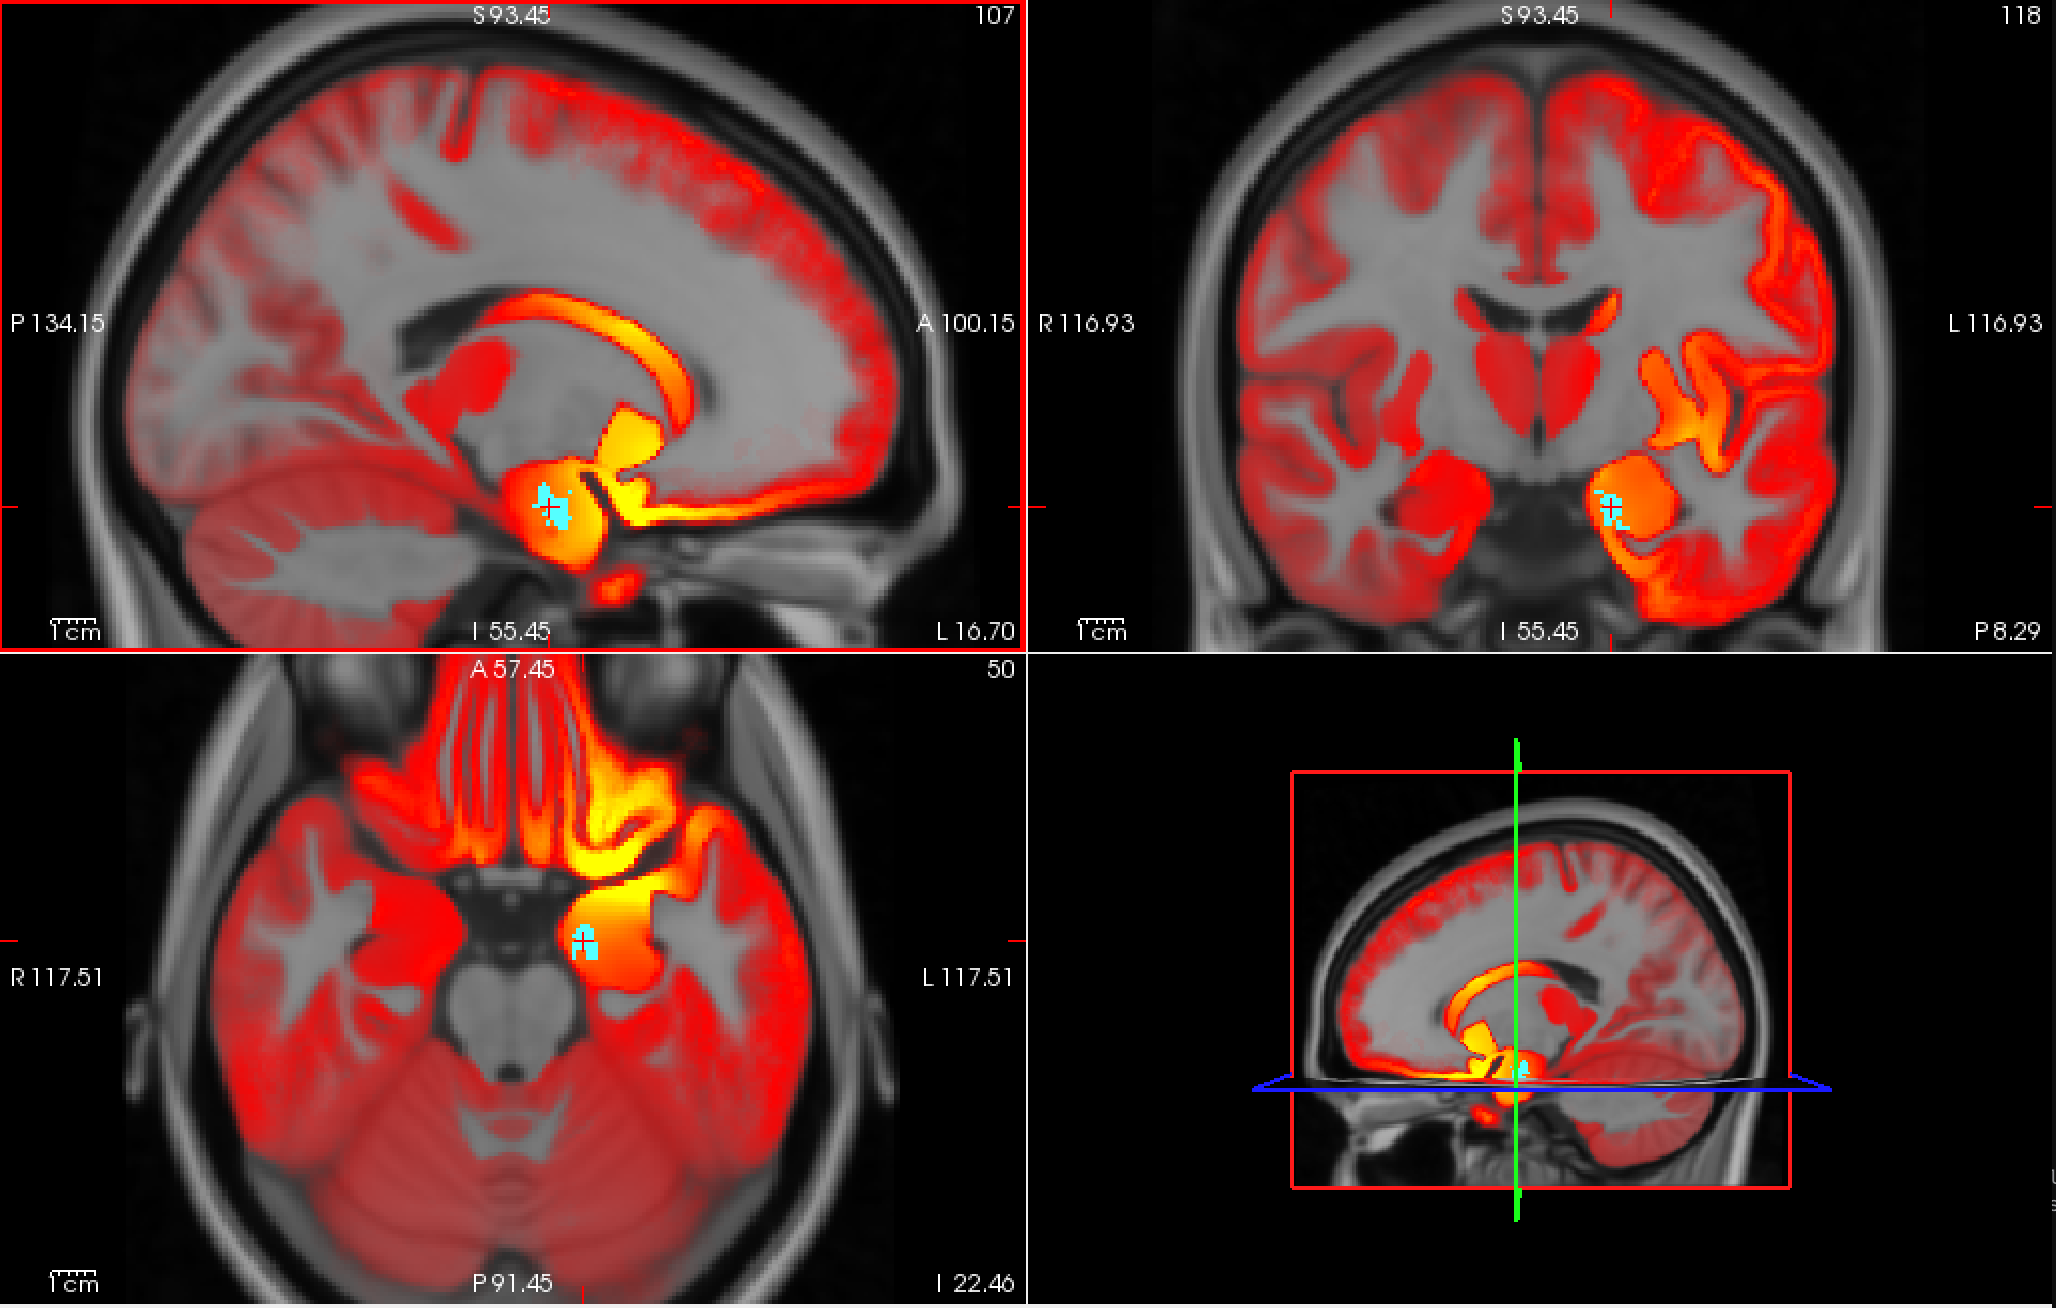 MNI T1 template with a cohort-level
 TI_max field average and a significant cluster from cluster-based permutation testing.
Technical Details
Data Requirements
- File Format: NIfTI files in MNI space
- File Pattern: Default
grey_{simulation_name}_TI_MNI_MNI_TI_max.nii.gz - Data Type: Electric field magnitude values
- Analysis Types: Both classification and correlation approaches supported
How many subjects you need
A permutation test can only be as fine-grained as the number of ways the labels can be
rearranged, and with a handful of subjects that number is tiny. In a group comparison with
three subjects split 2-vs-1 there are exactly C(3,1) = 3 relabellings, so the null
distribution has three members — one of which is your own data. The smallest cluster
p-value the design can ever produce is therefore 1/3 (about 0.33), and the estimator the
toolbox actually uses is one notch more conservative still. No cluster can clear
p < 0.05, whatever the effect size.
So zero significant clusters from three subjects is the correct answer, not a failure.
The run is still worth doing — the t_statistics and p_values maps are real and show you
where and how large the effect is — but cluster-level inference needs more subjects. As a
rule of thumb, a two-sided test at α = 0.05 needs at least 1/0.05 = 20 distinct
relabellings, which a balanced group comparison first reaches at three per group
(C(6,3) = 20); six or more per group is where the null becomes finely enough resolved to
be informative.
CSV-Based Configuration
Classification Mode CSV
Create subjects_classification.csv:
subject_id,simulation_name,response
001,HIPP_L,1
002,HIPP_L,0
003,HIPP_R,1
004,HIPP_R,0
response: 1 = Responder, 0 = Non-Responder
Correlation Mode CSV
Create subjects_correlation.csv:
subject_id,simulation_name,effect_size,weight
001,HIPP_L,0.85,1.0
002,HIPP_L,0.72,0.8
003,HIPP_R,0.91,1.0
004,HIPP_R,0.65,1.2
effect_size: Continuous outcome measure (e.g., effect size, % improvement)weight: Optional subject-specific weight (e.g., sample size, reliability measure)
Statistical Implementation
Classification Analysis
- Test: Two-sample t-test (paired or unpaired)
- Permutations: Random group reassignment
- Cluster Correction: Family-wise error control at cluster level
Correlation Analysis
- Test: Pearson or Spearman correlation
- Permutations: Random outcome measure shuffling
- Cluster Correction: Family-wise error control at cluster level
- Weights: Optional weighted correlation analysis
References
General Methodology
- Maris, E., & Oostenveld, R. (2007). Nonparametric statistical testing of EEG-and MEG-data. Journal of Neuroscience Methods, 164(1), 177-190.
- Nichols, T. E., & Holmes, A. P. (2002). Nonparametric permutation tests for functional neuroimaging: a primer with examples. Human Brain Mapping, 15(1), 1-25.
- Winkler, A. M., et al. (2014). Permutation inference for the general linear model. NeuroImage, 92, 381-397.
Group Comparison (Classification)
- Bullmore, E. T., et al. (1999). Global, voxel, and cluster tests, by theory and permutation, for a difference between two groups of structural MR images of the brain. IEEE Transactions on Medical Imaging, 18(1), 32-42.
Correlation Analysis (ACES)
- Sack, A. T., et al. (2021). ACES: Automated Correlation of Electric field Strength and Stimulation effects. bioRxiv. [Preprint]
- Bikson, M., et al. (2021). Rational and irrational approaches to transcranial electrical stimulation. Clinical Neurophysiology, 132(10), 2189-2196.
- Huang, Y., et al. (2019). Measurements and models of electric fields in the in vivo human brain during transcranial electric stimulation. eLife, 8, e38834.