Visualizers
The TI-Toolbox provides integrated visualization tools for examining simulation results in both mesh and NIfTI formats. Two primary visualization applications are available: Gmsh for mesh visualization and Freeview for NIfTI volume visualization.
Gmsh Mesh Visualizer
Gmsh is used to visualize tetrahedral mesh files (.msh) generated during finite element simulations. It provides 3D visualization of:
- Mesh geometry and tetrahedral elements
- Electric field distributions on mesh surfaces
- Tissue boundaries and material interfaces
- Electrode positions and configurations
How to Use Gmsh
- From the Analyzer Tab: Navigate to the Analyzer tab in the main TI-Toolbox GUI
- Select Subject: Choose the subject you want to visualize from the dropdown
- Select Simulation: Choose the simulation containing the analysis results
- Select Analysis: Choose the specific analysis
- Launch Gmsh: Click the “Launch Gmsh” button
The system will automatically:
- Locate the appropriate .msh file in your project’s
Analyses/Mesh/directory - Launch Gmsh with the correct file path
- Display the mesh with electric field data
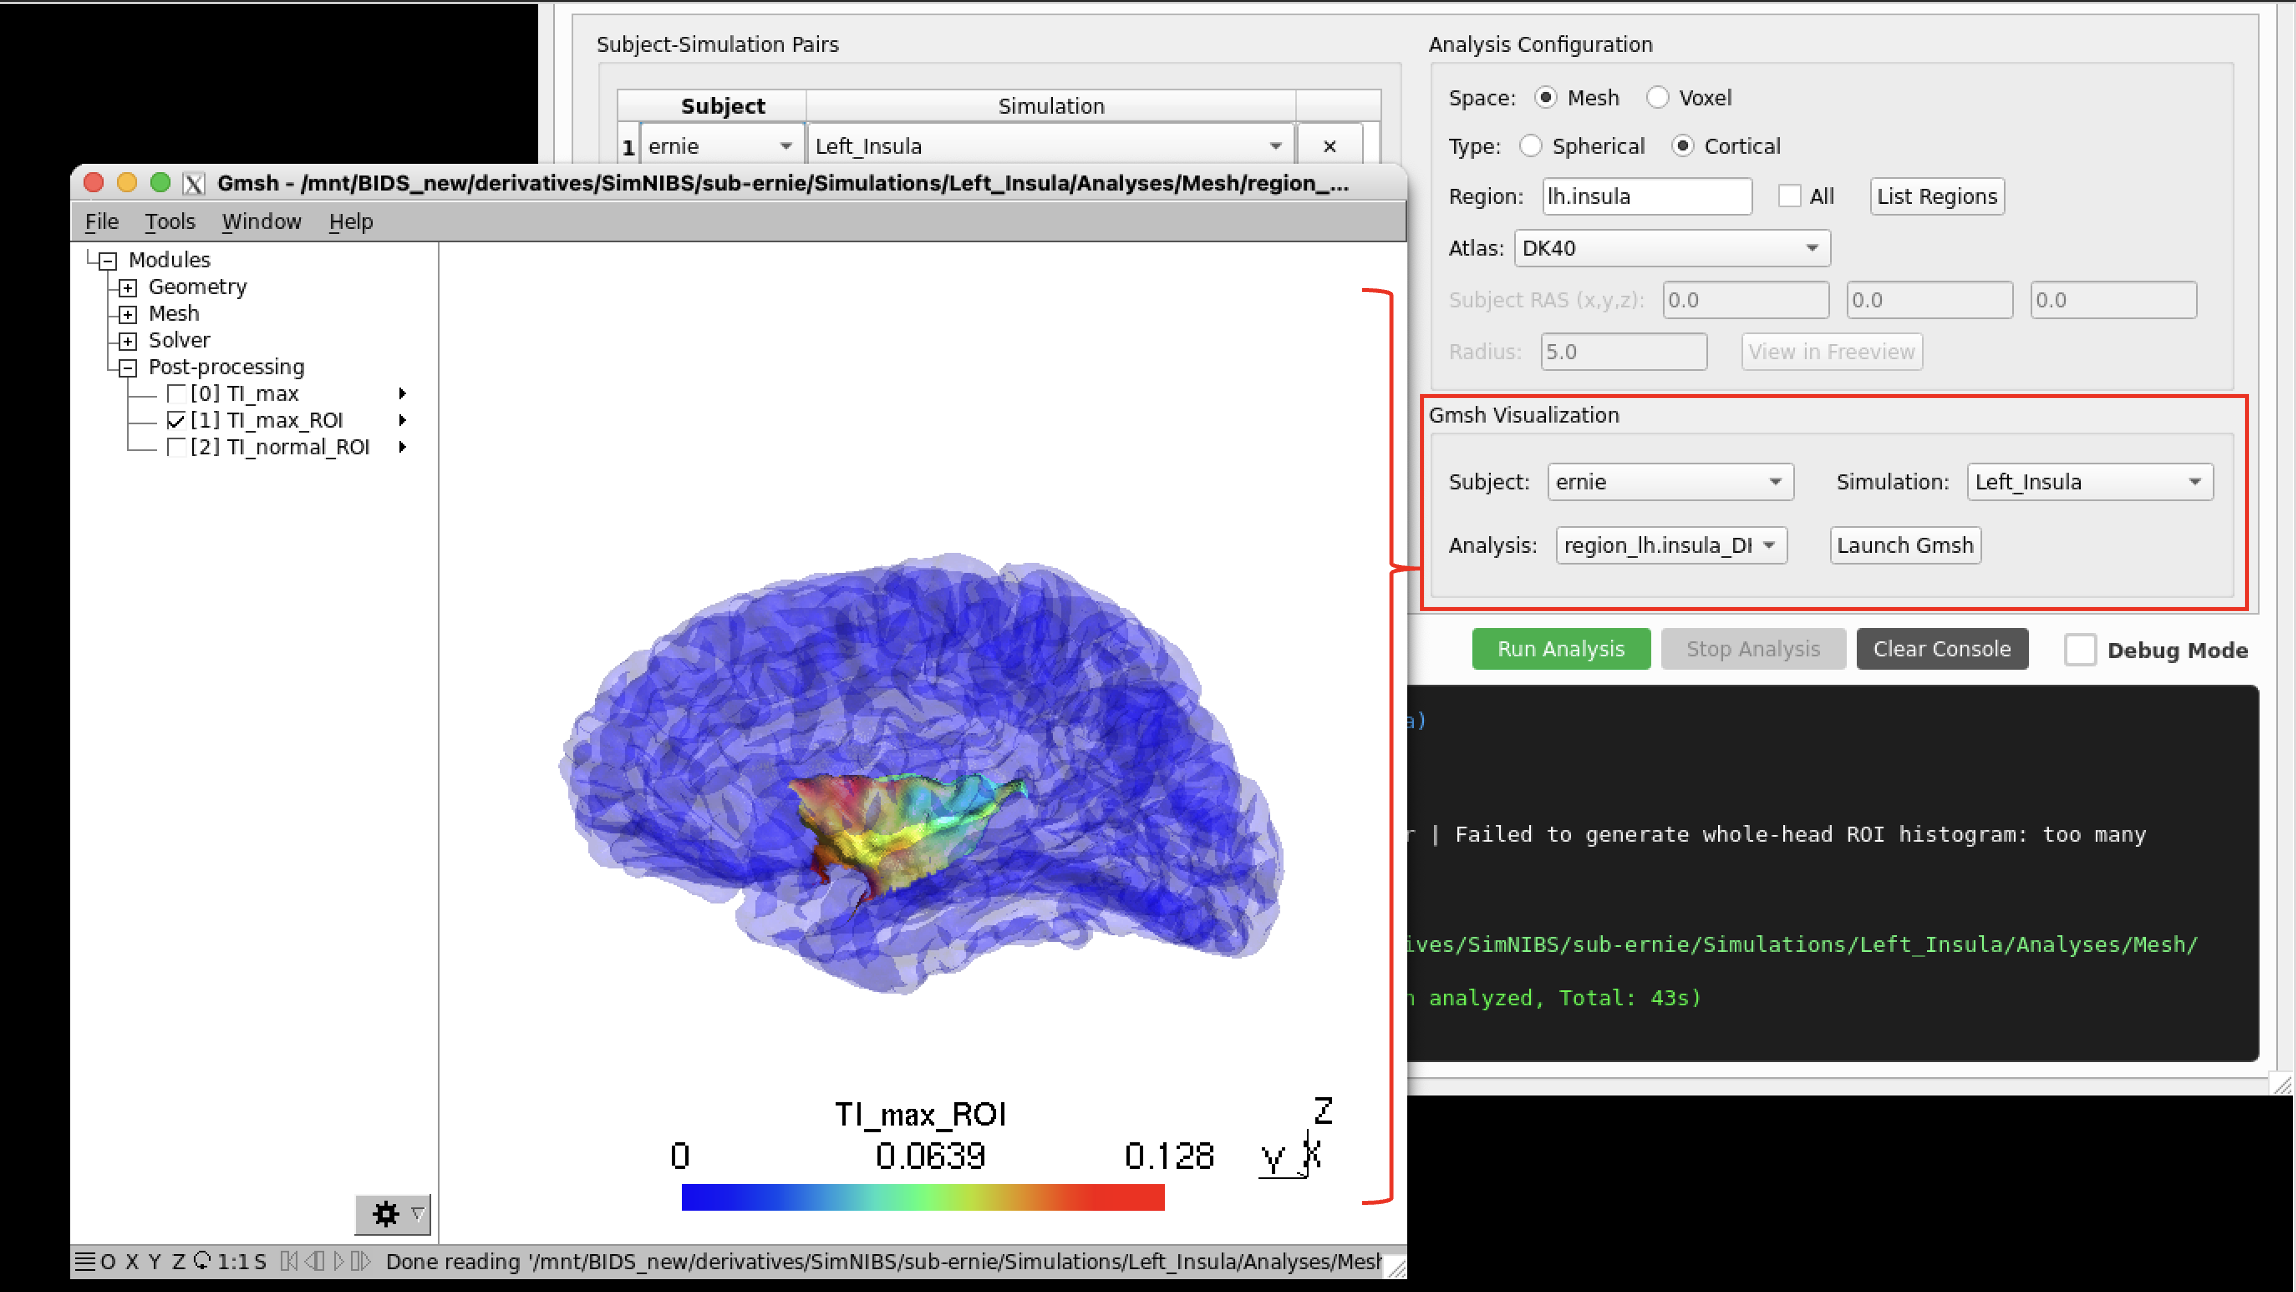 Gmsh launching with mesh visualization
Gmsh Interface and Tools
Gmsh provides several menu options for enhanced visualization:
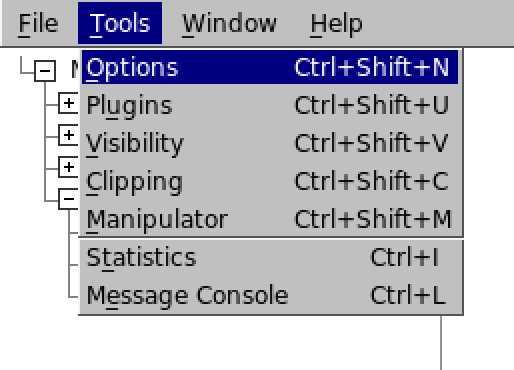 Gmsh tools menu. Useful for clipping mesh, changing visibility of elements and manipulating general options.
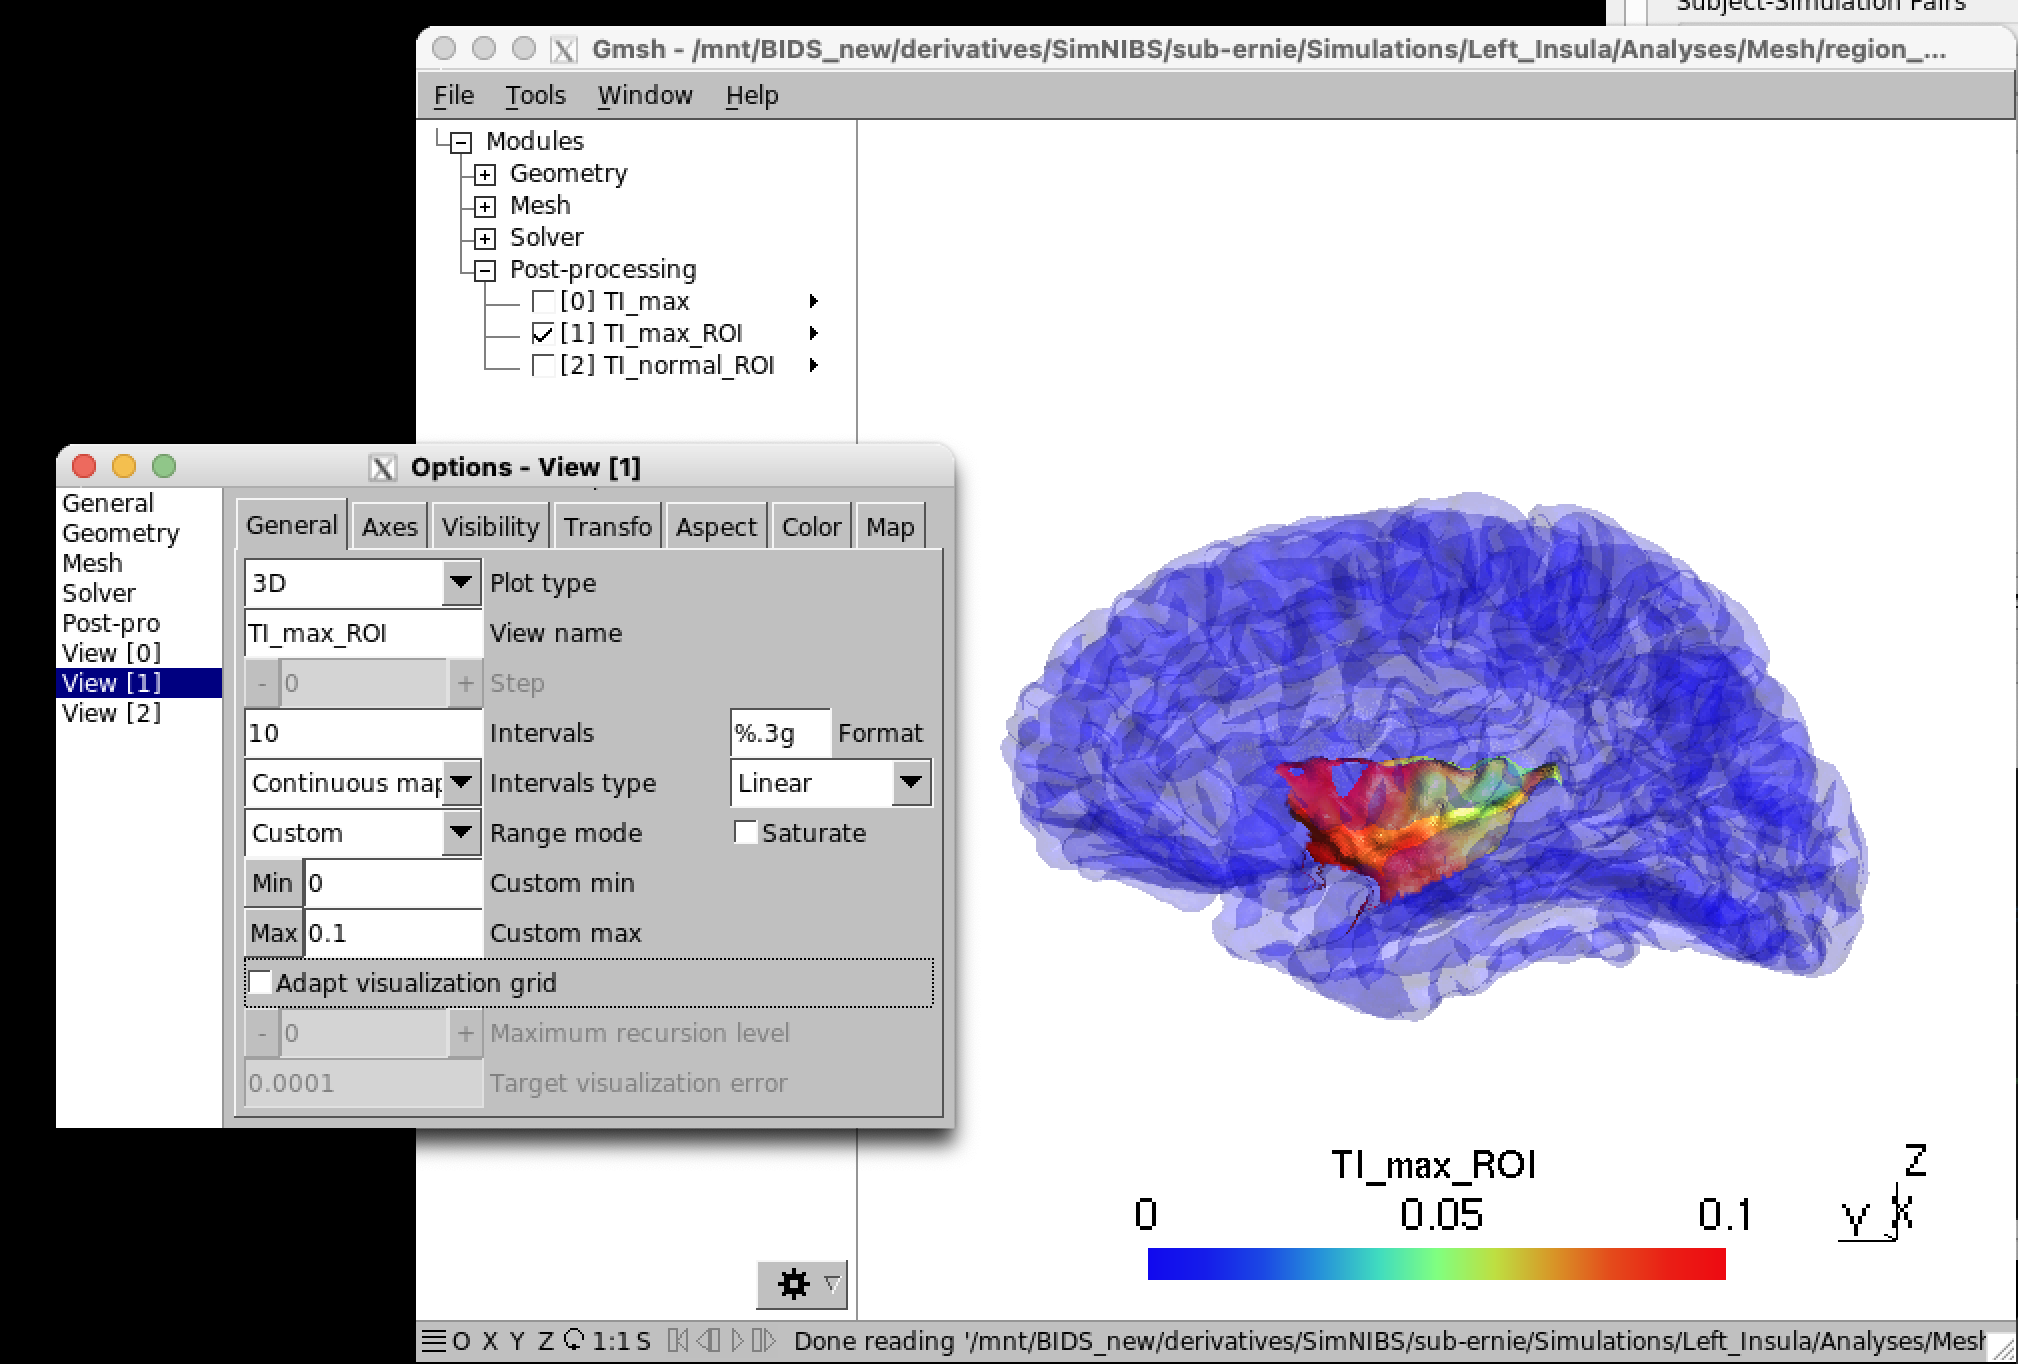 Gmsh options menu for view controls. Useful for changing color schemes, visualization cutoffs, mesh settings and more
Gmsh Tips
- Navigation: Use mouse to rotate, zoom, and pan the 3D view
- Field Visualization: Electric field magnitude is typically displayed as surface colors
- Mesh Quality: You can inspect mesh element quality and density
- Export: Gmsh allows exporting images and animations for reports
For more information please visit the following resources:
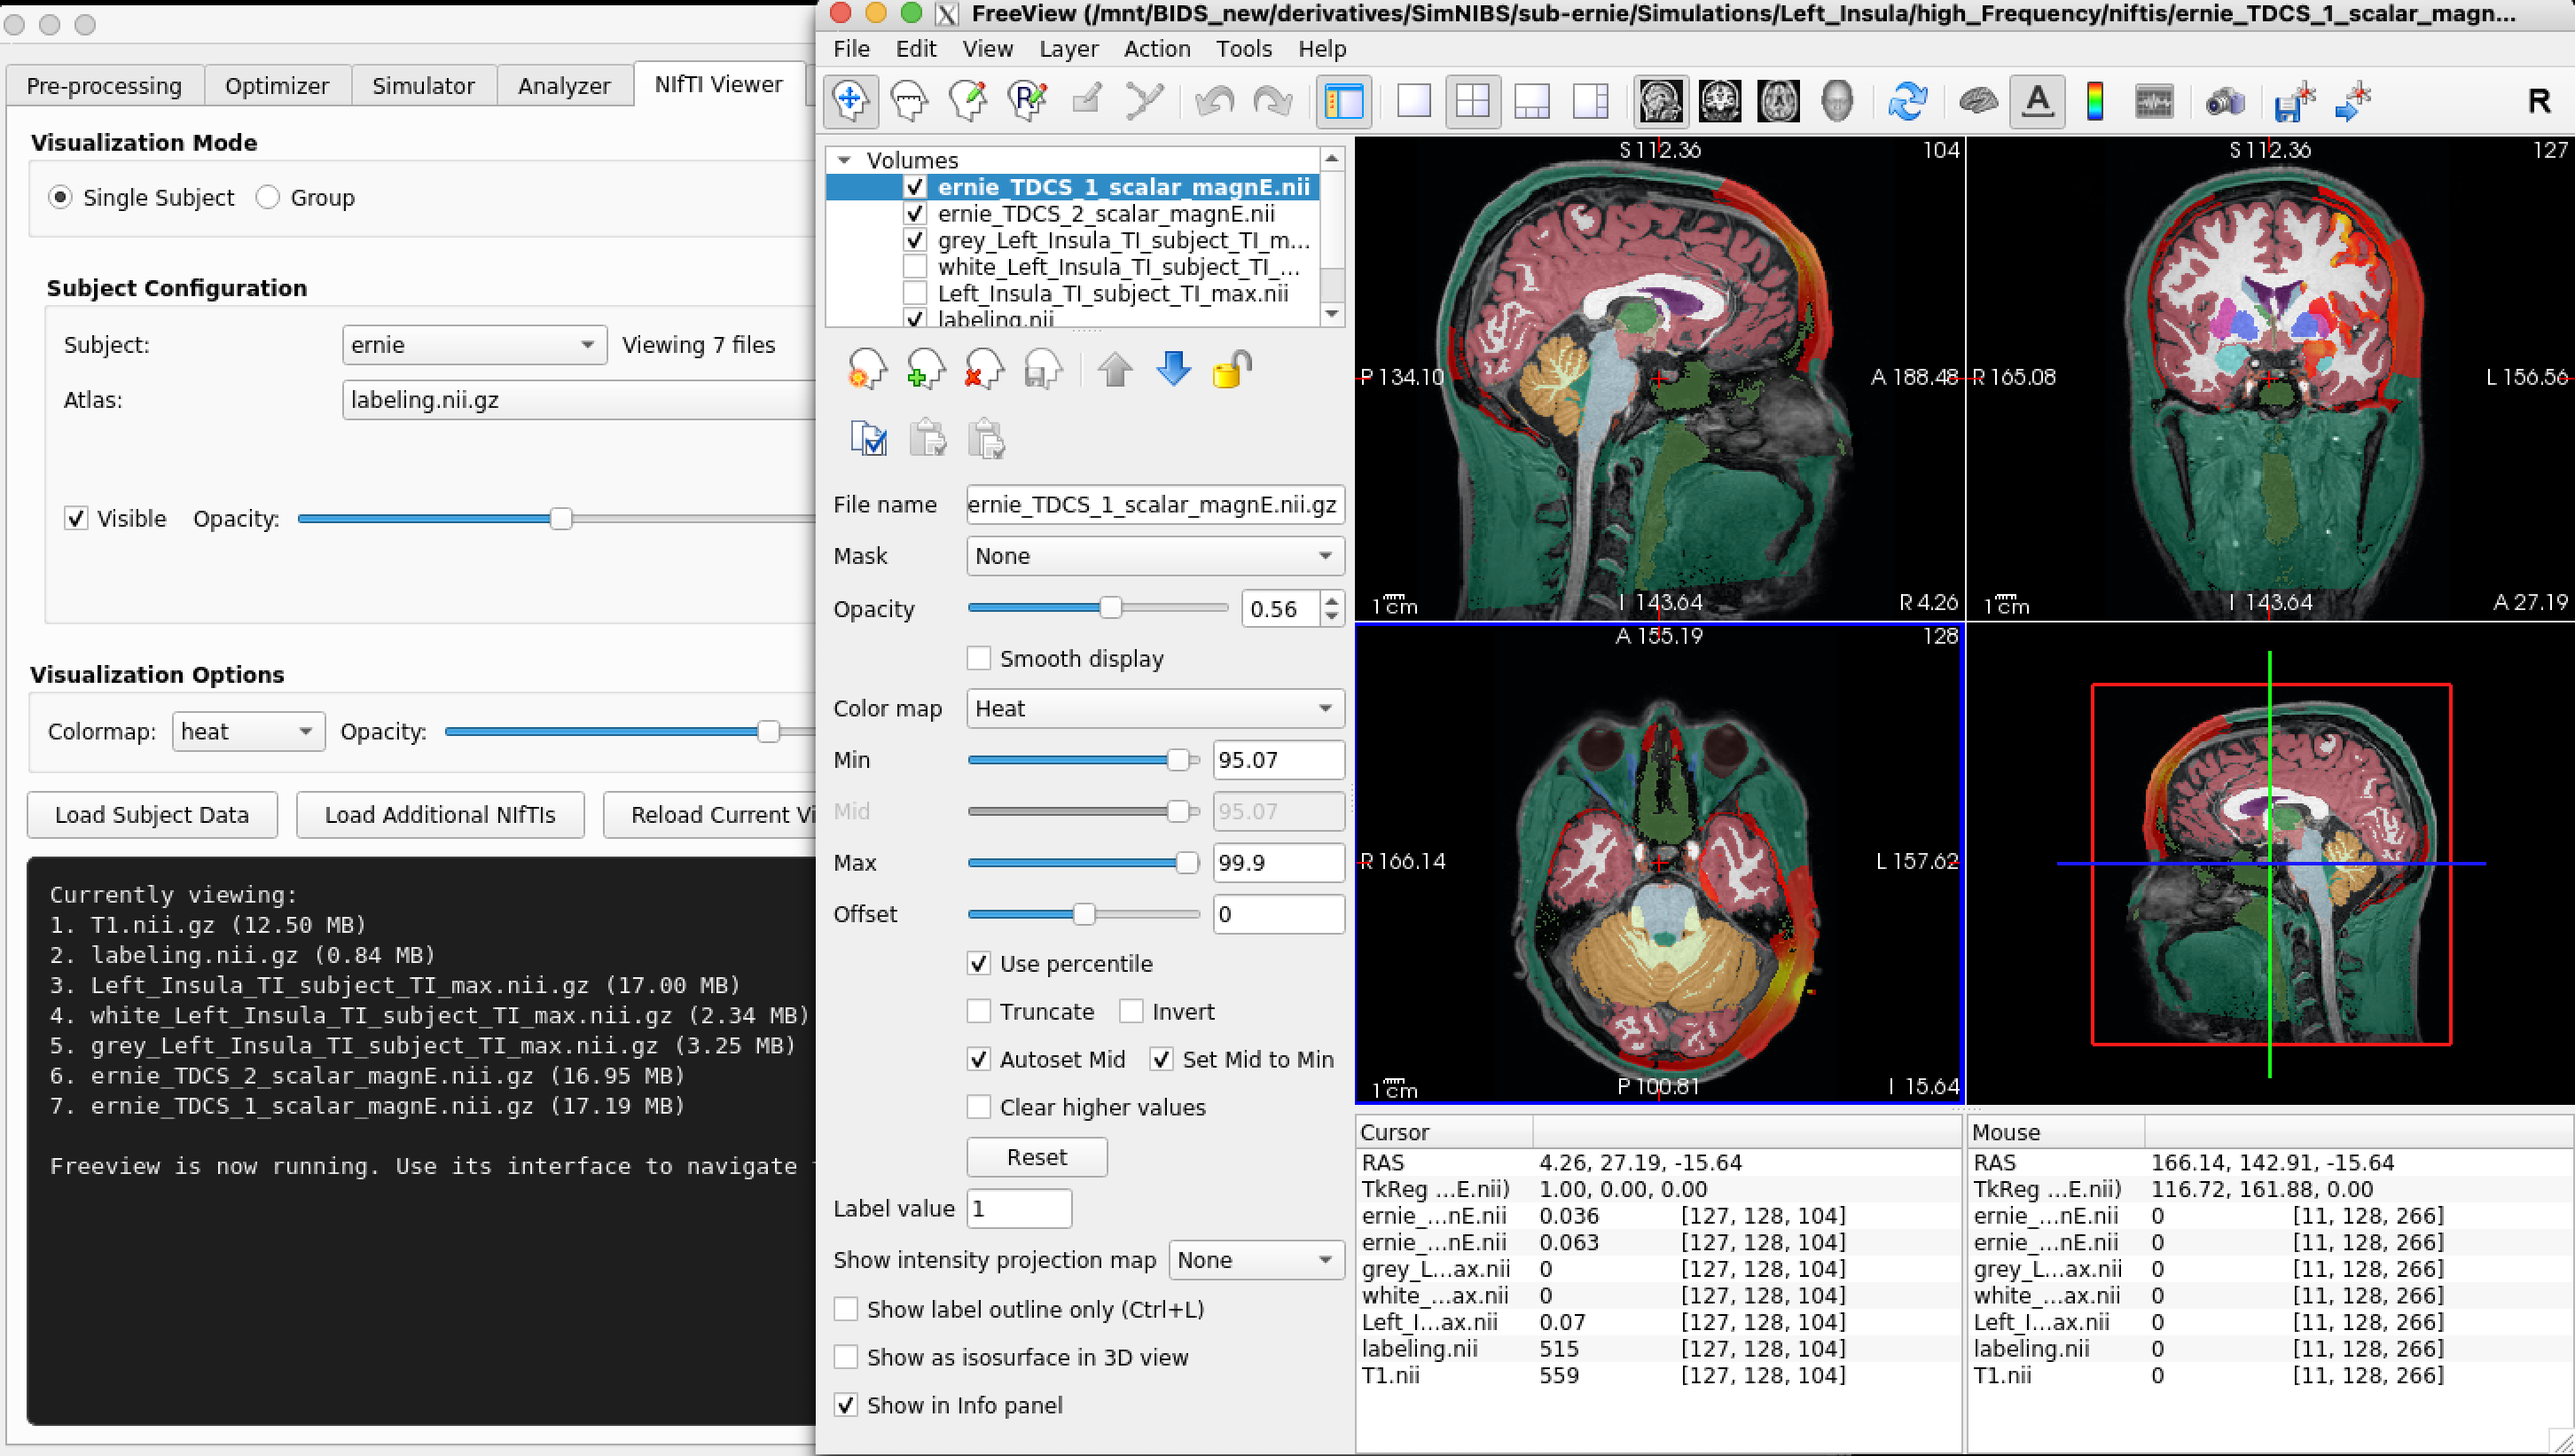
Freeview NIfTI Visualizer
Freeview is used to visualize volumetric NIfTI files (.nii/.nii.gz) and provides comprehensive brain imaging capabilities including:
- Anatomical MRI visualization
- Electric field overlays on brain anatomy
- Atlas-based region of interest (ROI) visualization
- Multi-subject comparison views
- Statistical overlay maps
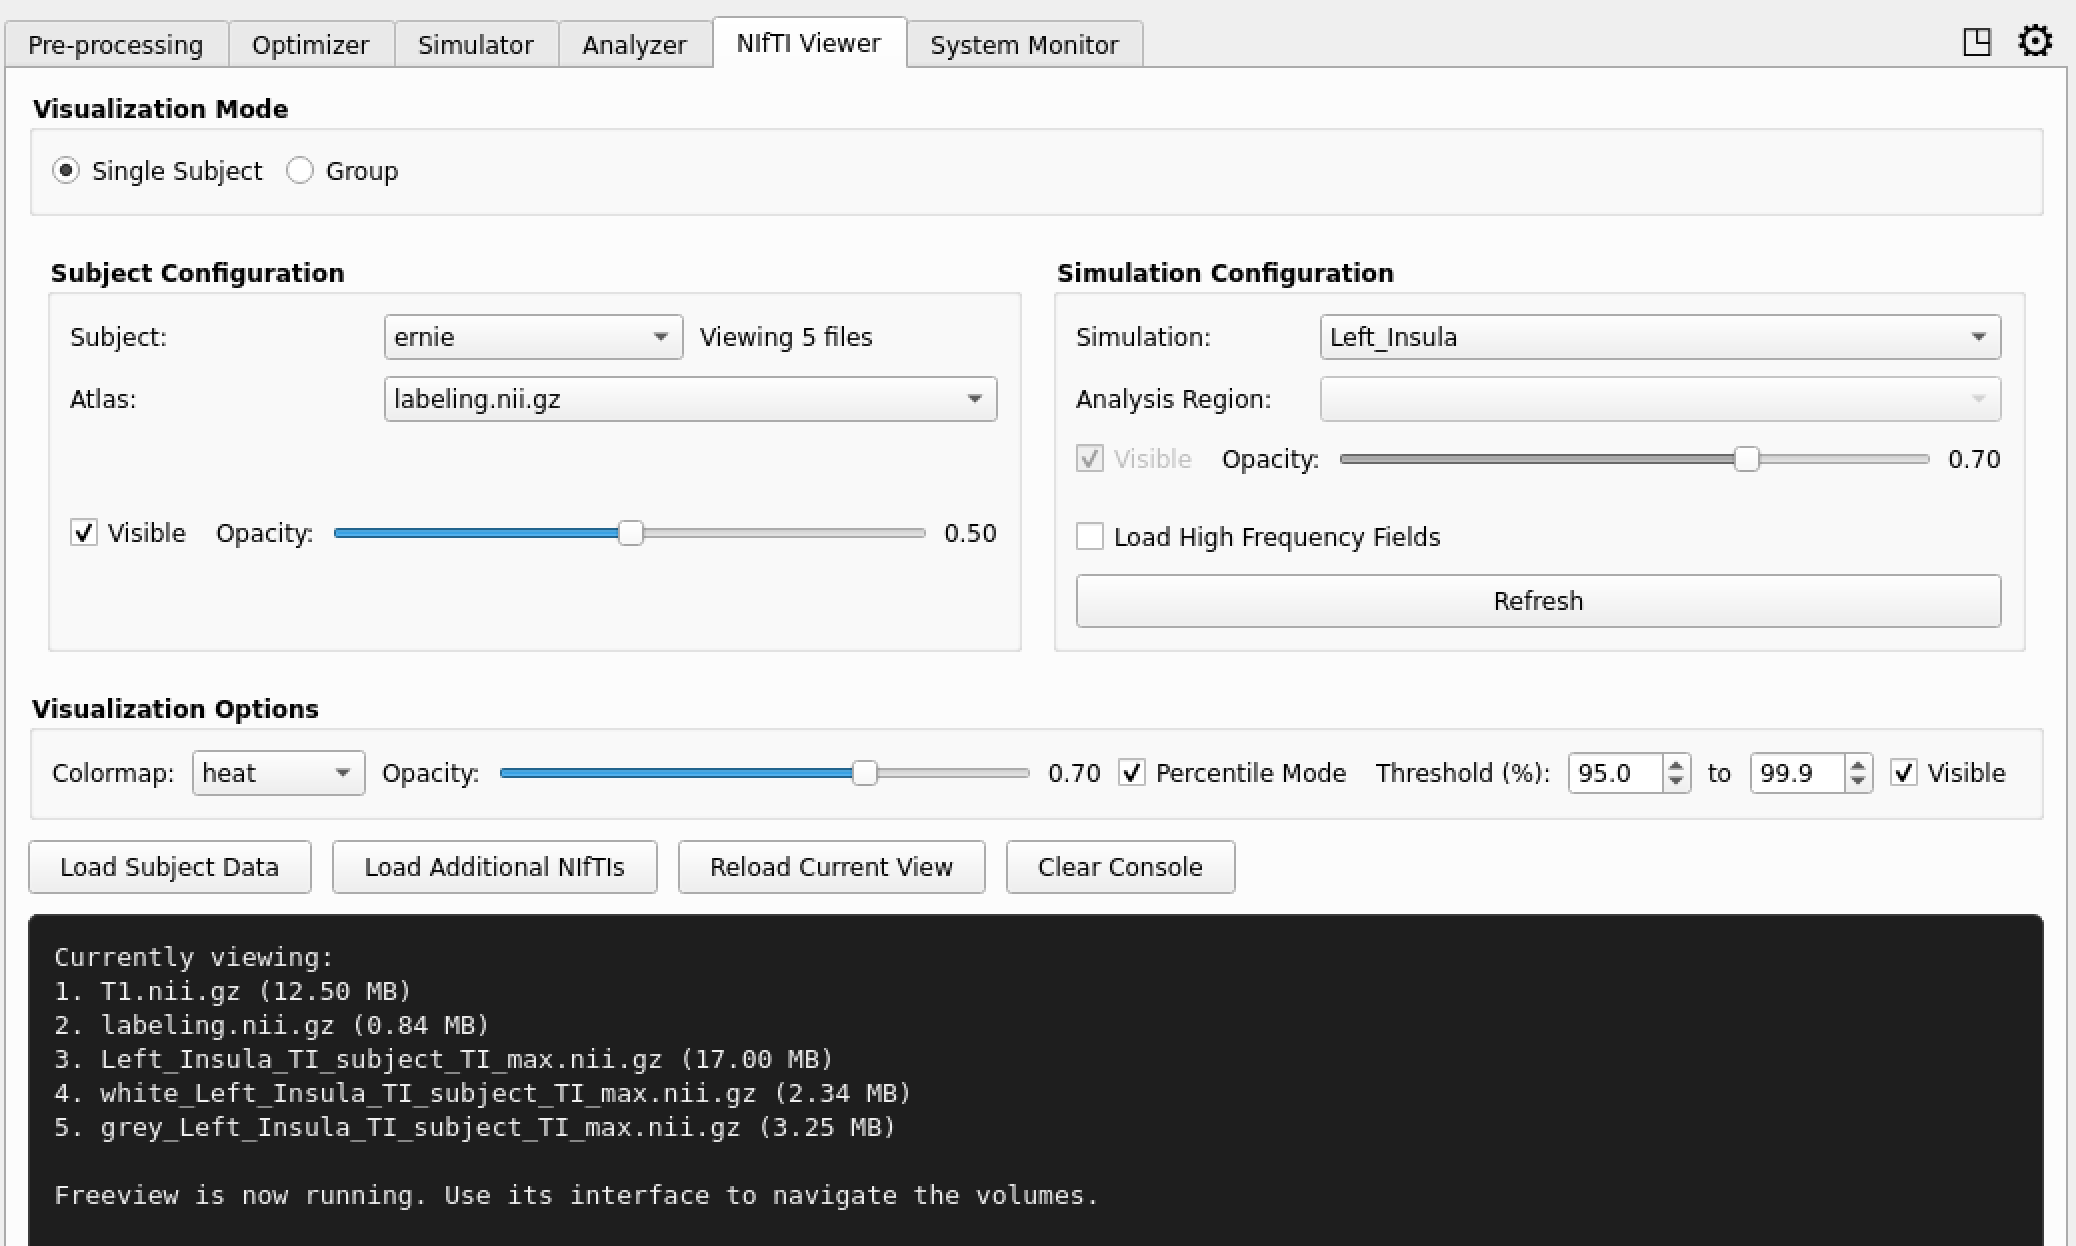
The TI-Toolbox’s NIfTI Viewer tab automates multi-layer visualization with sensible defaults including percentile-based thresholding (95th-99.9th percentile), opacity controls (70% default), and automatic loading of anatomical atlases.
How to Use Freeview
- Navigate to NIfTI Viewer: Click on the “NIfTI Viewer” tab in the main TI-Toolbox GUI
- Select Visualization Mode:
- Single Subject: Visualize one subject at a time
- Group Mode: Compare multiple subjects simultaneously in MNI space
Single Subject Mode
- Select Subject: Choose from available subjects
- Select Simulation: Choose the simulation to visualize
- Select Analysis: Choose the analysis type (e.g., E-field magnitude)
- Configure Visualization:
- Colormap: Choose color scheme (e.g., heat, jet, plasma)
- Thresholds: Set minimum and maximum values for display
- Opacity: Control overlay transparency
- Atlas Overlay: Add anatomical atlas labels
- Launch Freeview: Click “Launch Freeview”
 Freeview menu showing overlay controls and atlas options
 Freeview displaying E-field overlay on anatomical MRI
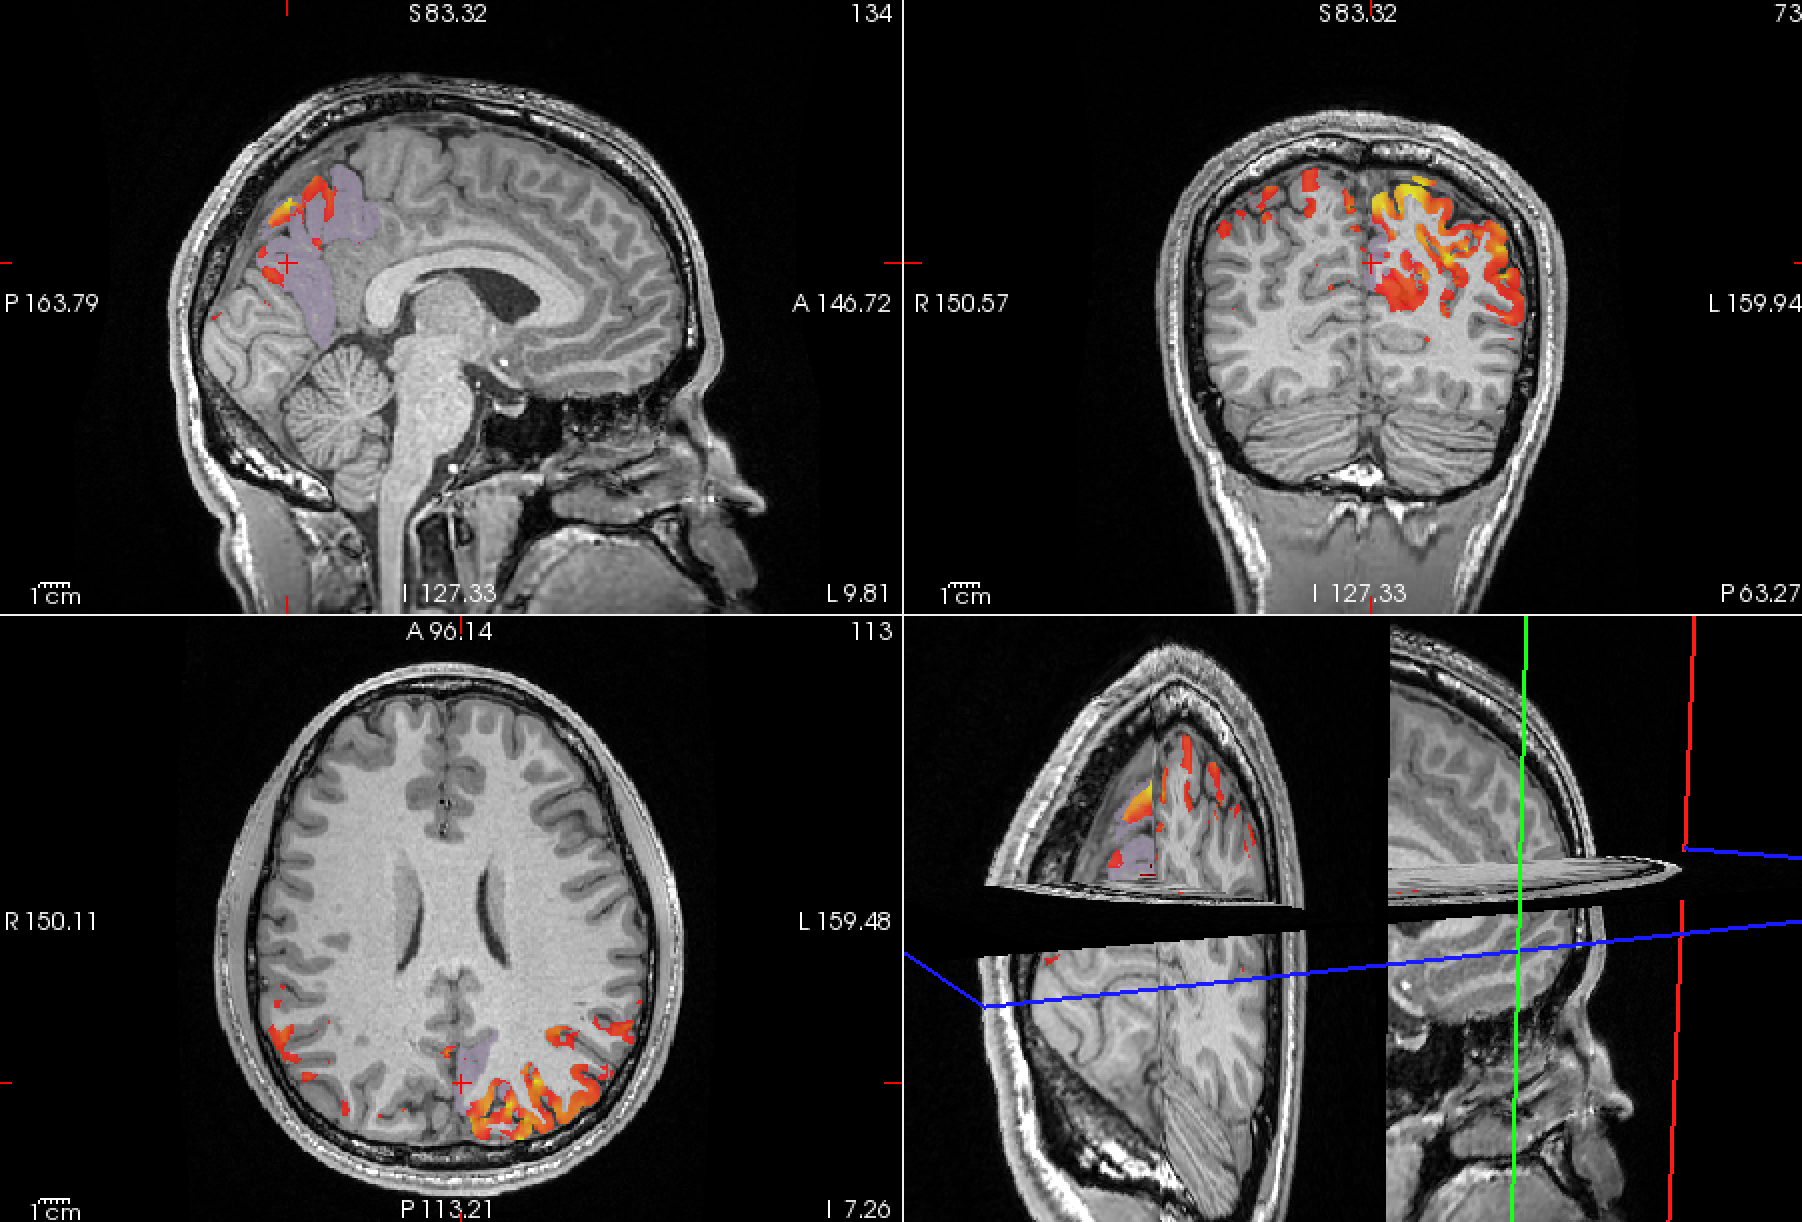 MRI ROI with field data overlay
Freeview Tips
- Navigation: Use mouse controls to navigate 3D brain space
- Slices: Toggle between axial, coronal, and sagittal views
- ROI Analysis: Use atlas overlays to identify brain regions
- Measurements: Freeview provides tools for measuring distances and volumes
- Screenshots: Capture images for documentation and reports
- Multi-Layer Control: Use the overlay panel to toggle visibility and adjust opacity of different data layers
File Formats and Locations
Mesh Files (.msh)
- Location:
project_dir/subjects/sub-{ID}/simulations/{sim_name}/Analyses/Mesh/{analysis_name}/ - Content: Tetrahedral mesh with embedded field data
- Visualizer: Gmsh
NIfTI Files (.nii/.nii.gz)
- Location:
project_dir/subjects/sub-{ID}/simulations/{sim_name}/Analyses/Voxel/{analysis_name}/ - Content: Volumetric data in standard neuroimaging format
- Visualizer: Freeview
Quick CLI Commands
For users who prefer command-line access or need to integrate visualization into scripts, you can launch the visualizers directly:
Gmsh CLI
# Basic mesh visualization
gmsh path/to/your/mesh.msh

# Examples with typical TI-Toolbox paths:
gmsh subjects/sub-01/simulations/my_simulation/Analyses/Mesh/E-field/ernie_montage_TI.msh
gmsh subjects/sub-02/simulations/flex_search/Analyses/Mesh/ROI_analysis/sphere_ROI.msh
Freeview CLI
# Basic NIfTI visualization
freeview path/to/your/file.nii.gz

# Multiple files with overlay options
freeview anatomical.nii.gz field_overlay.nii.gz:colormap=heat:opacity=0.7 atlas.nii.gz:lut=atlas_labels.txt

# Examples with typical TI-Toolbox paths:
freeview subjects/sub-01/simulations/my_simulation/Analyses/Voxel/E-field/E.nii.gz:colormap=plasma:opacity=0.8
freeview subjects/sub-01/m2m_sub-01/T1.nii.gz subjects/sub-01/simulations/my_simulation/Analyses/Voxel/E-field/E.nii.gz:colormap=heat:opacity=0.7:percentile=1
Note: Freeview supports advanced options like colormaps, opacity, thresholds, and atlas overlays. Use :colormap=heat, :opacity=0.7, :percentile=1, etc.
Troubleshooting
Gmsh Issues
No mesh files found
- Ensure the analysis has been run and completed
- Check that the analysis output includes mesh visualization files
Freeview Issues
Empty or incorrect visualization
- Check that NIfTI files exist in the expected location
- Verify analysis parameters and thresholds are appropriate
- Ensure atlas files are available if using atlas overlays
Integration with Analysis Pipeline
Both visualizers are designed to work seamlessly with the TI-Toolbox analysis pipeline:
- Run Simulations: Use Flex Search or Ex Search to generate simulation parameters
- Execute Analysis: Run the analyzer to generate field distributions
- Visualize Results: Launch appropriate visualizer based on data type (mesh vs. voxel)
- Iterate: Use visualization insights to refine simulation parameters
Gallery
For visual examples of Gmsh and Freeview outputs, see the Gmsh Freeview Gallery page.
Note: Both Gmsh and Freeview are external applications that must be installed separately from the TI-Toolbox. The toolbox provides convenient launchers but does not include the visualization software itself.