Analysis Gallery
Comprehensive analysis and visualization of TI simulation results, field distributions, and statistical metrics.
Field Analysis & Visualization in mesh space (Gmsh Integration)
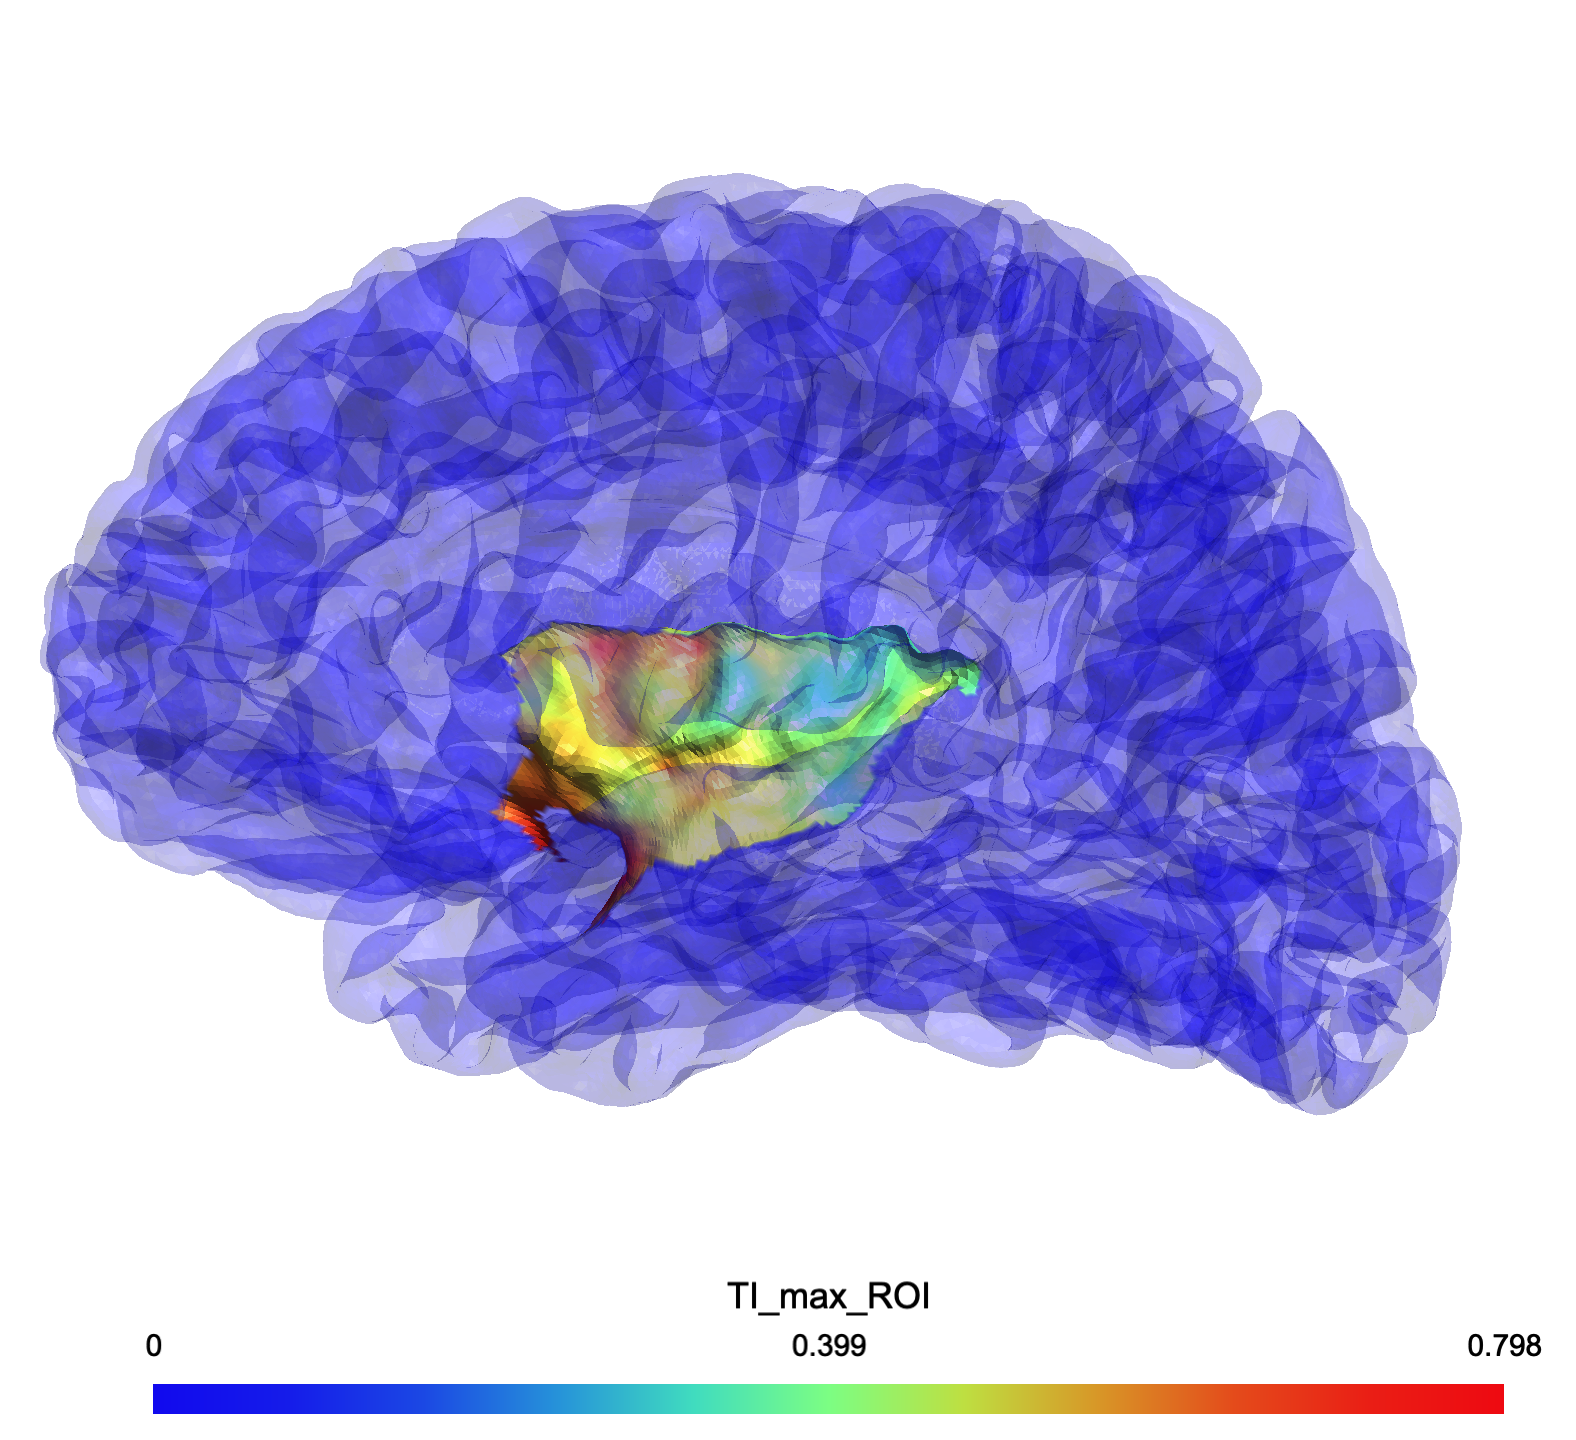
TImax (norm, modulation depth) field distribution showing intensity map in the cortical ROI (Left Insula).
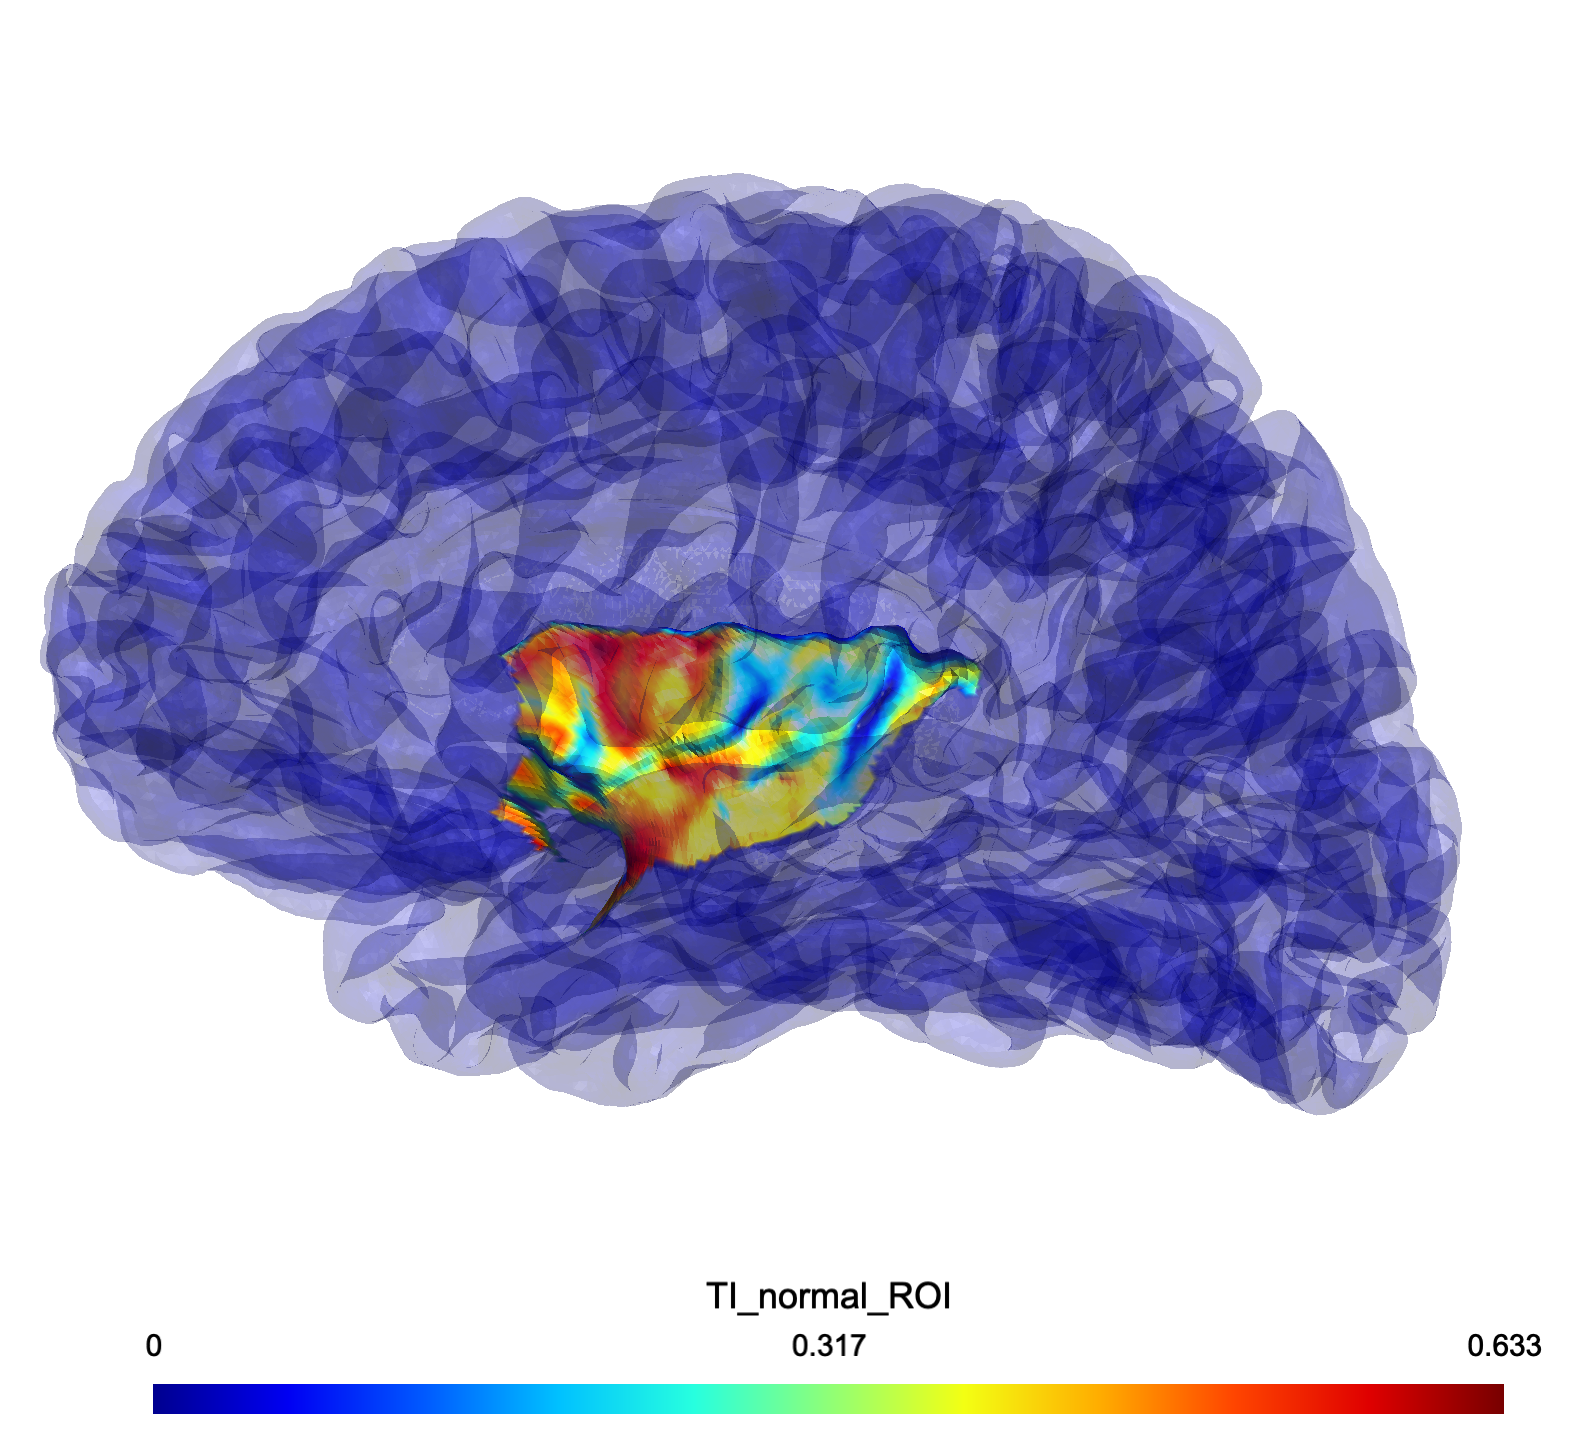
Normal component of the TImax field distribution showing intensity map in the cortical ROI (Left Insula)
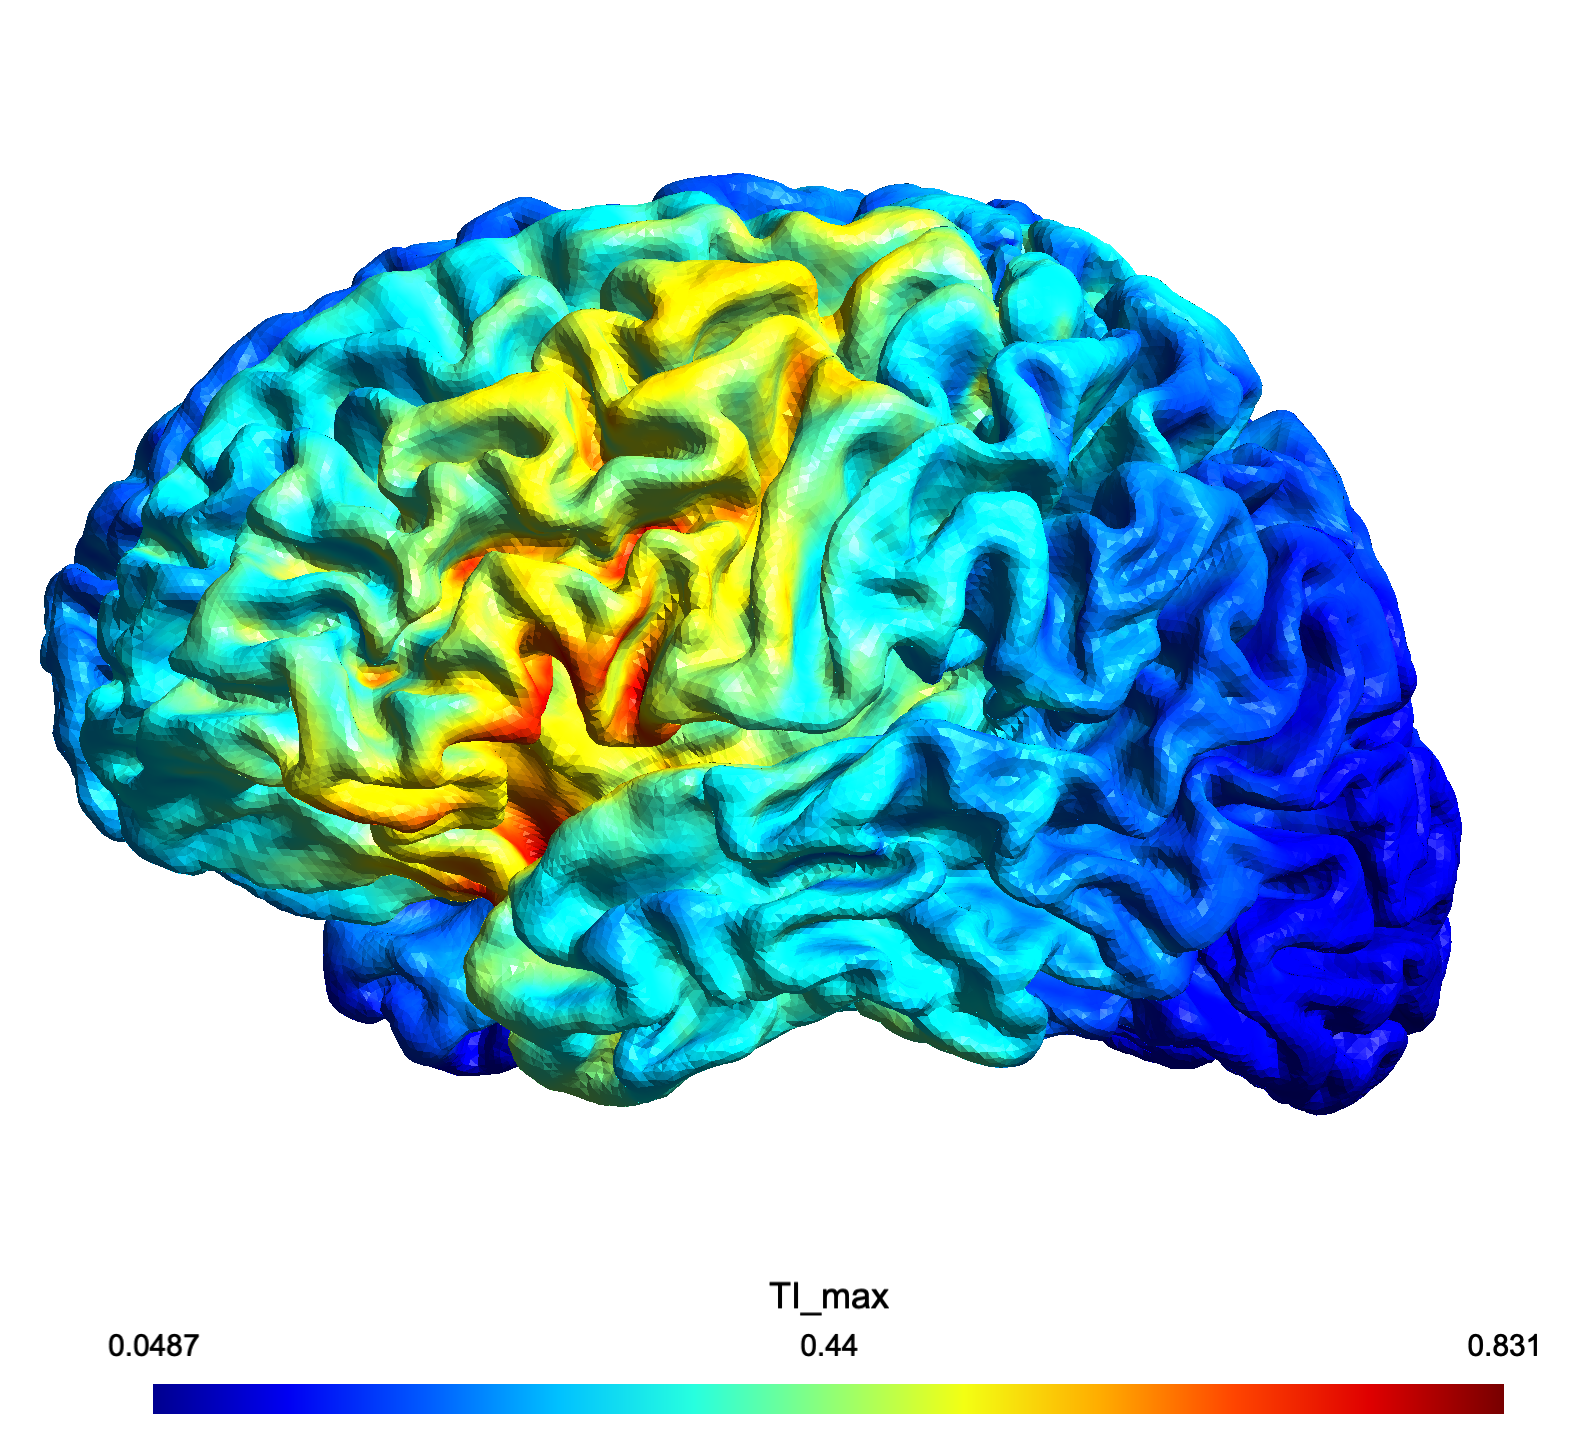
TImax field distribution showing intensity map across the entire brain.
Field Analysis & Visualization in voxel space (Freesurfer Integration)
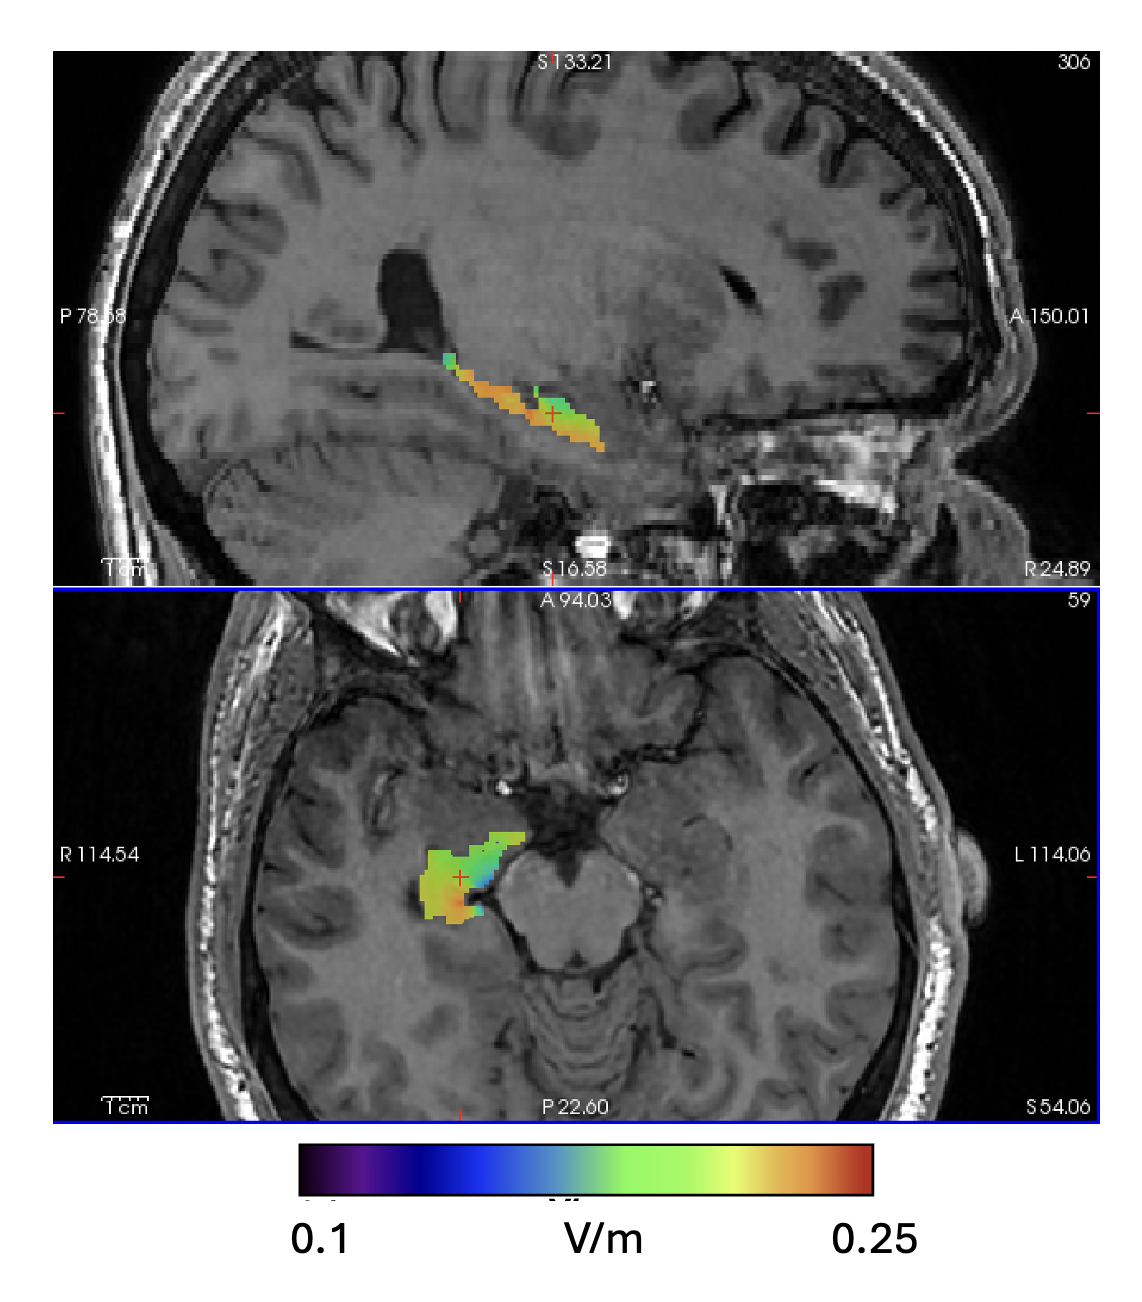
Montage A: TImax field distribution showing intensity map in the sub-cortical ROI (Right Hippocampus).
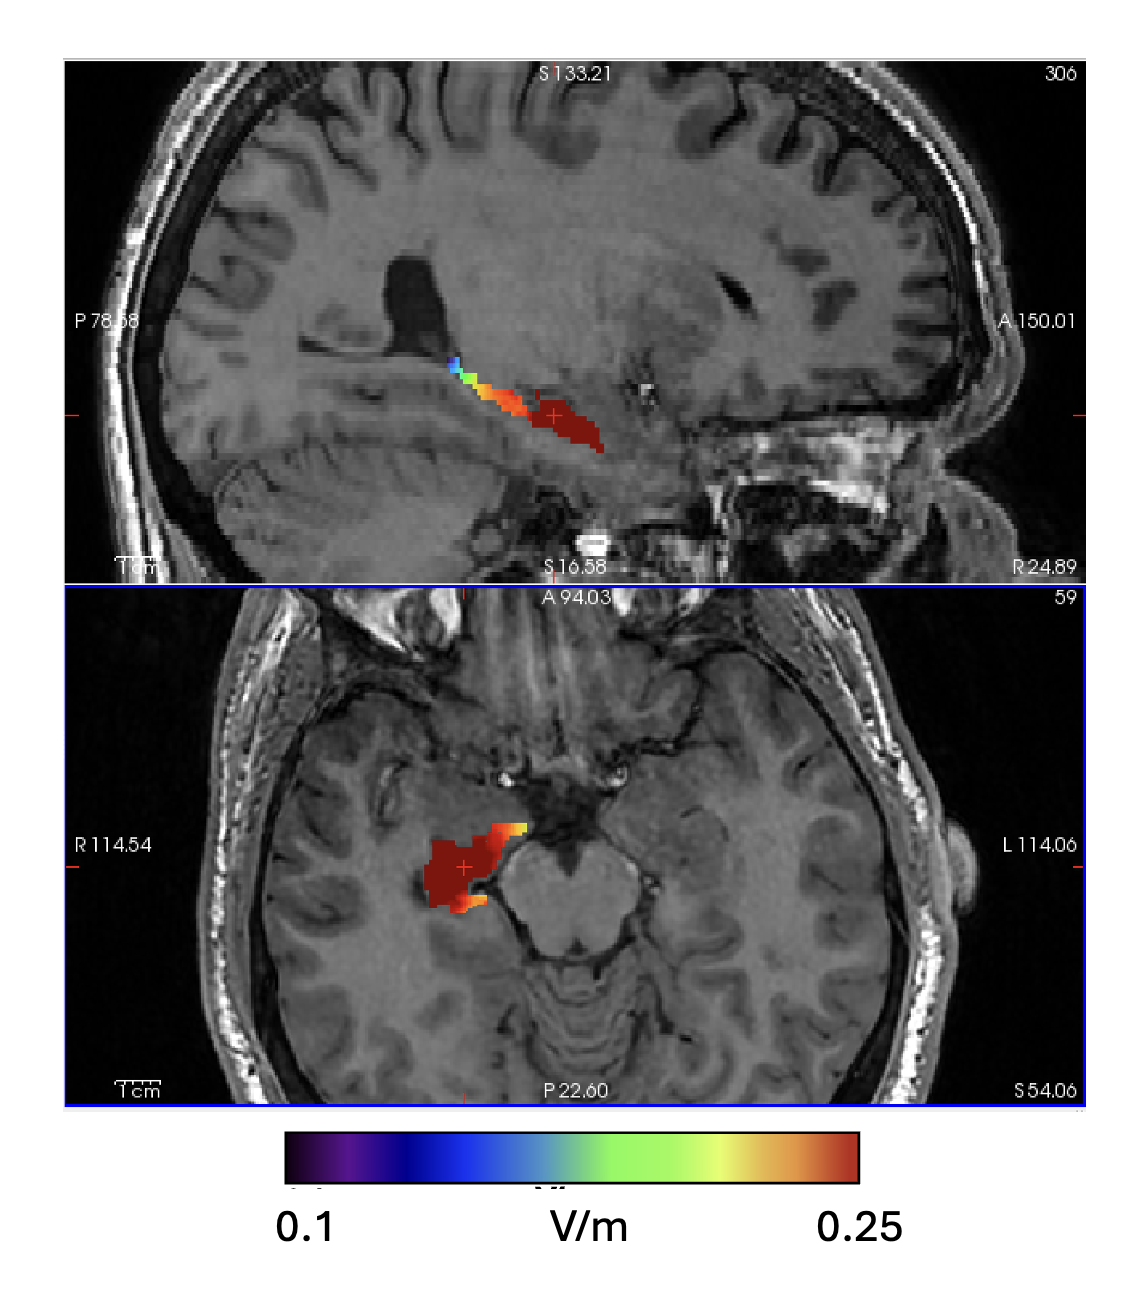
Montage B: TImax field distribution showing intensity map in the sub-cortical ROI (Right Hippocampus).
Statistical Analysis & Metrics
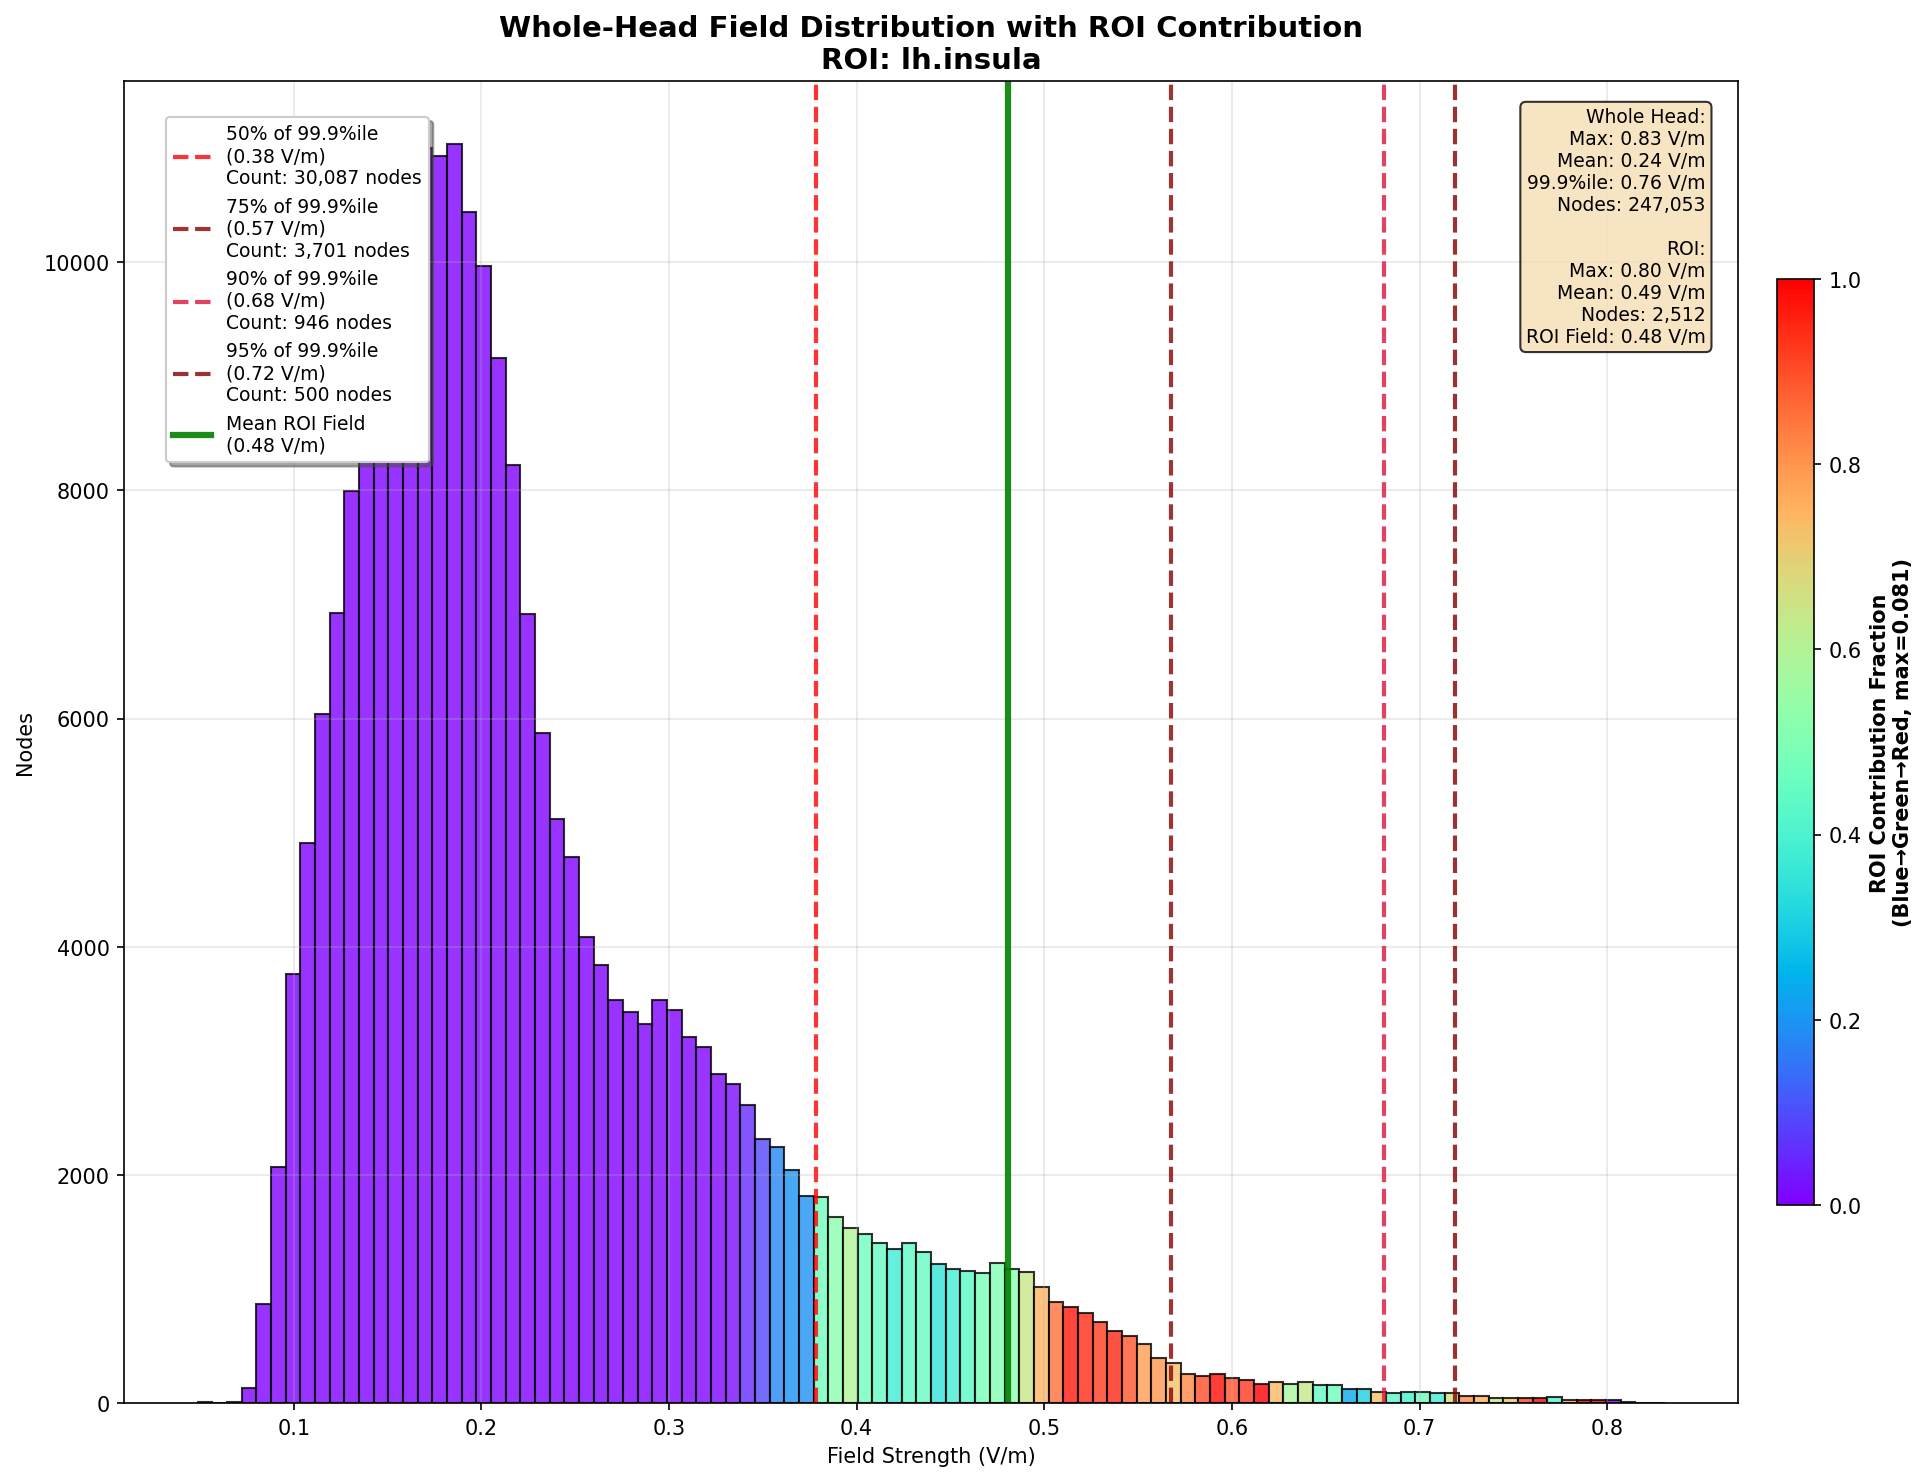
Histogram showing focality, intensity cutoffs, and relationship to ROI
×
![]()